Evidence of Time: From Order to Chaos
Experimental Data Visualization, Material Transformation & Publication Design
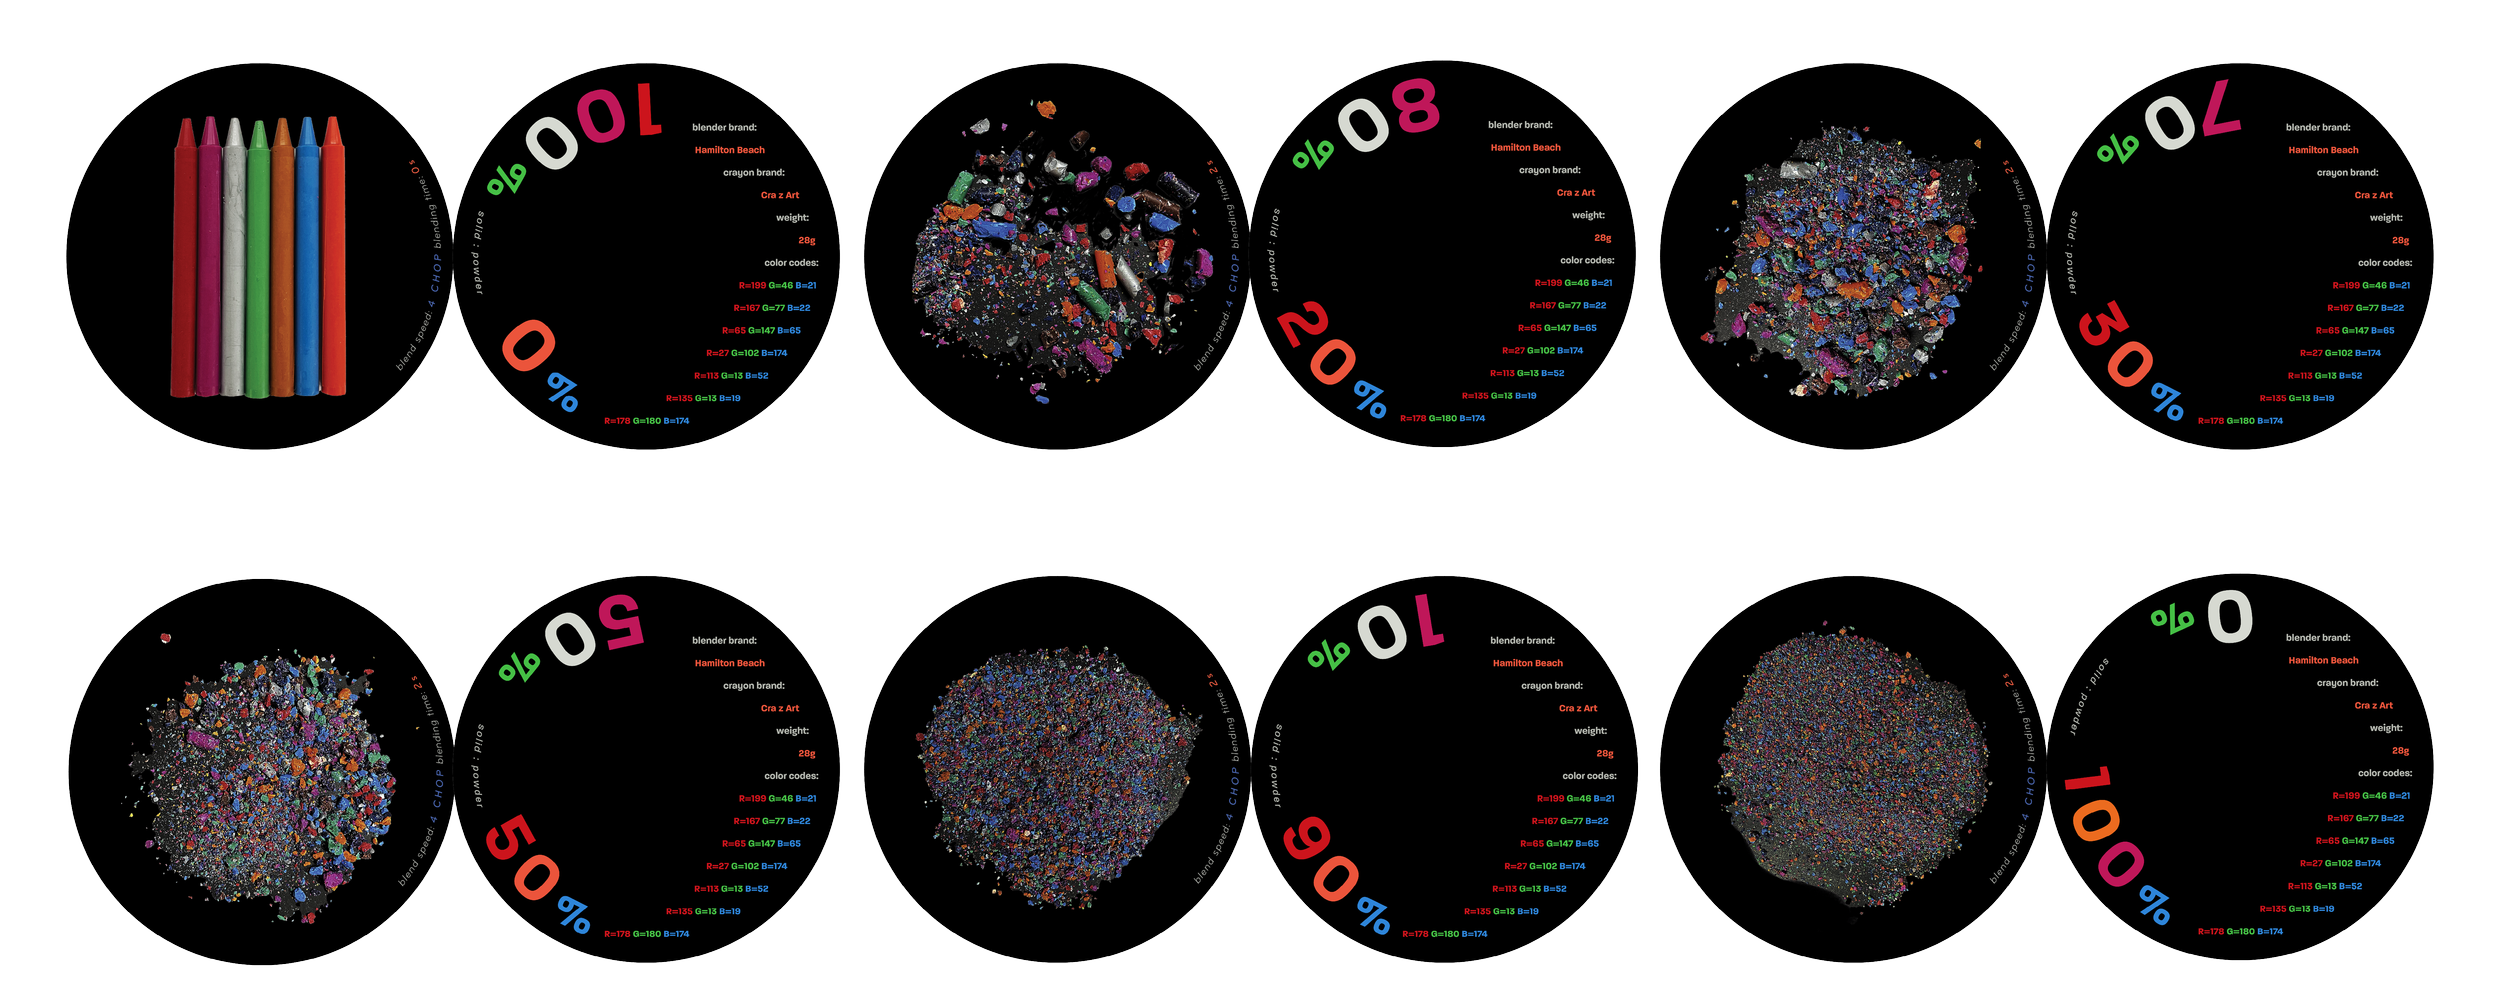
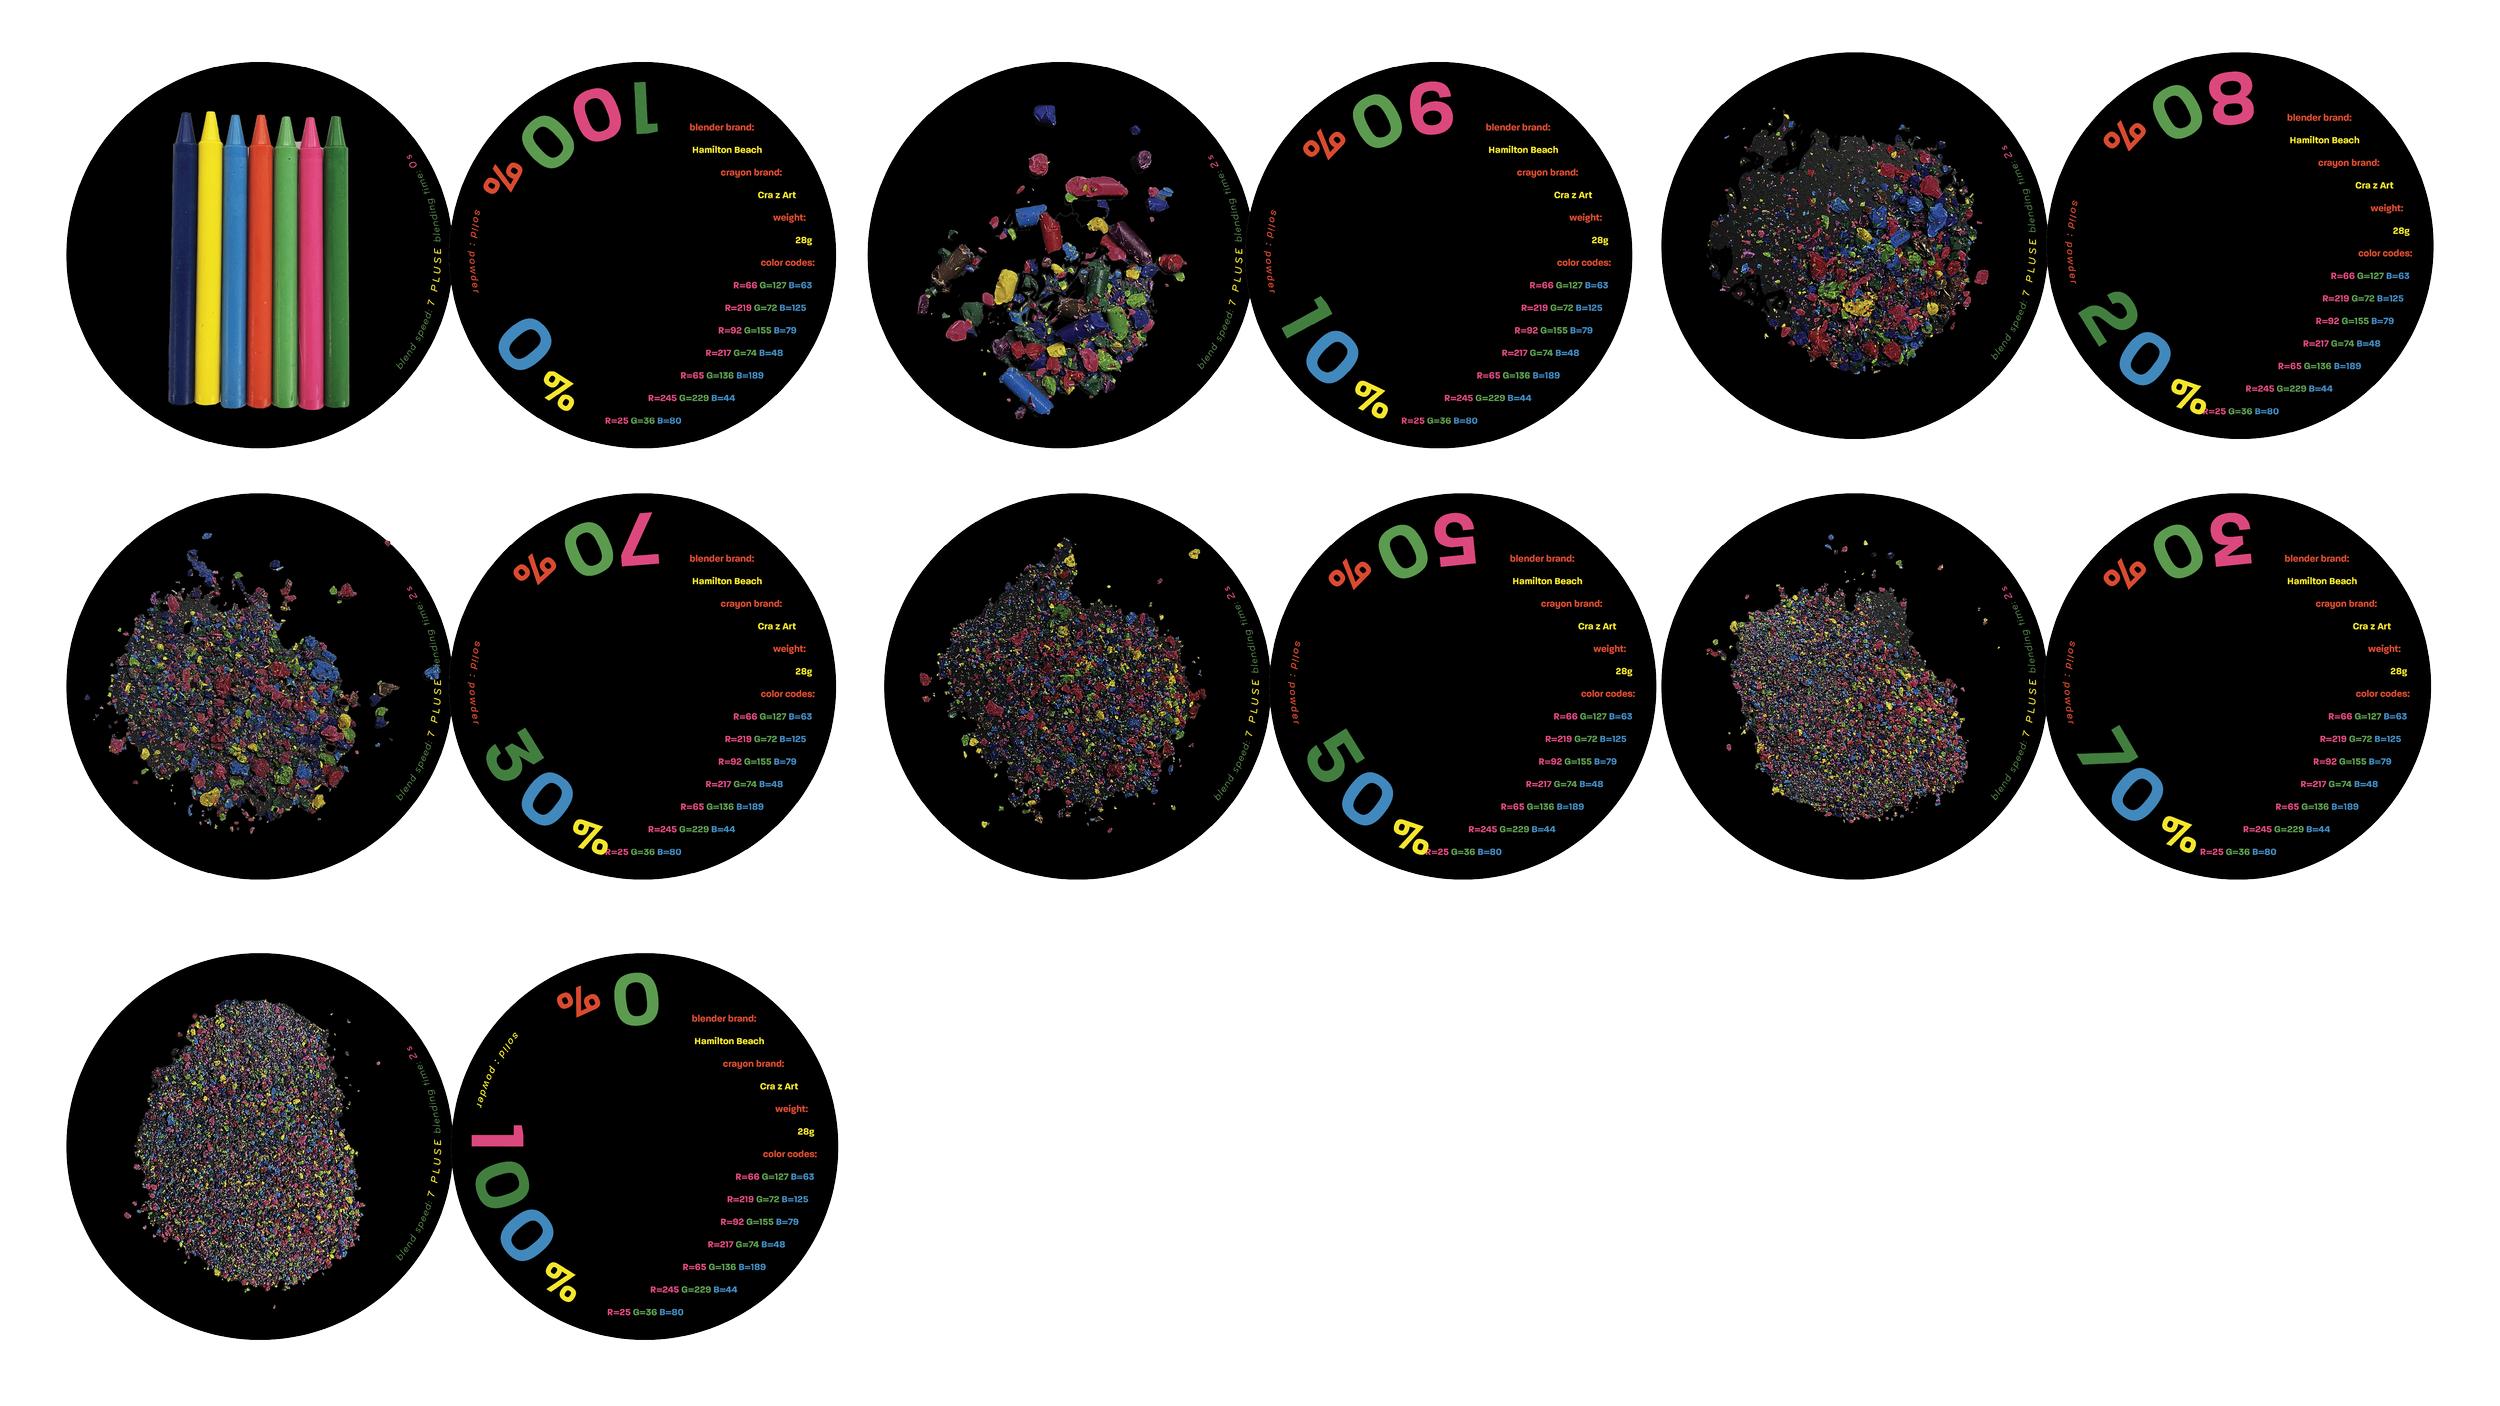
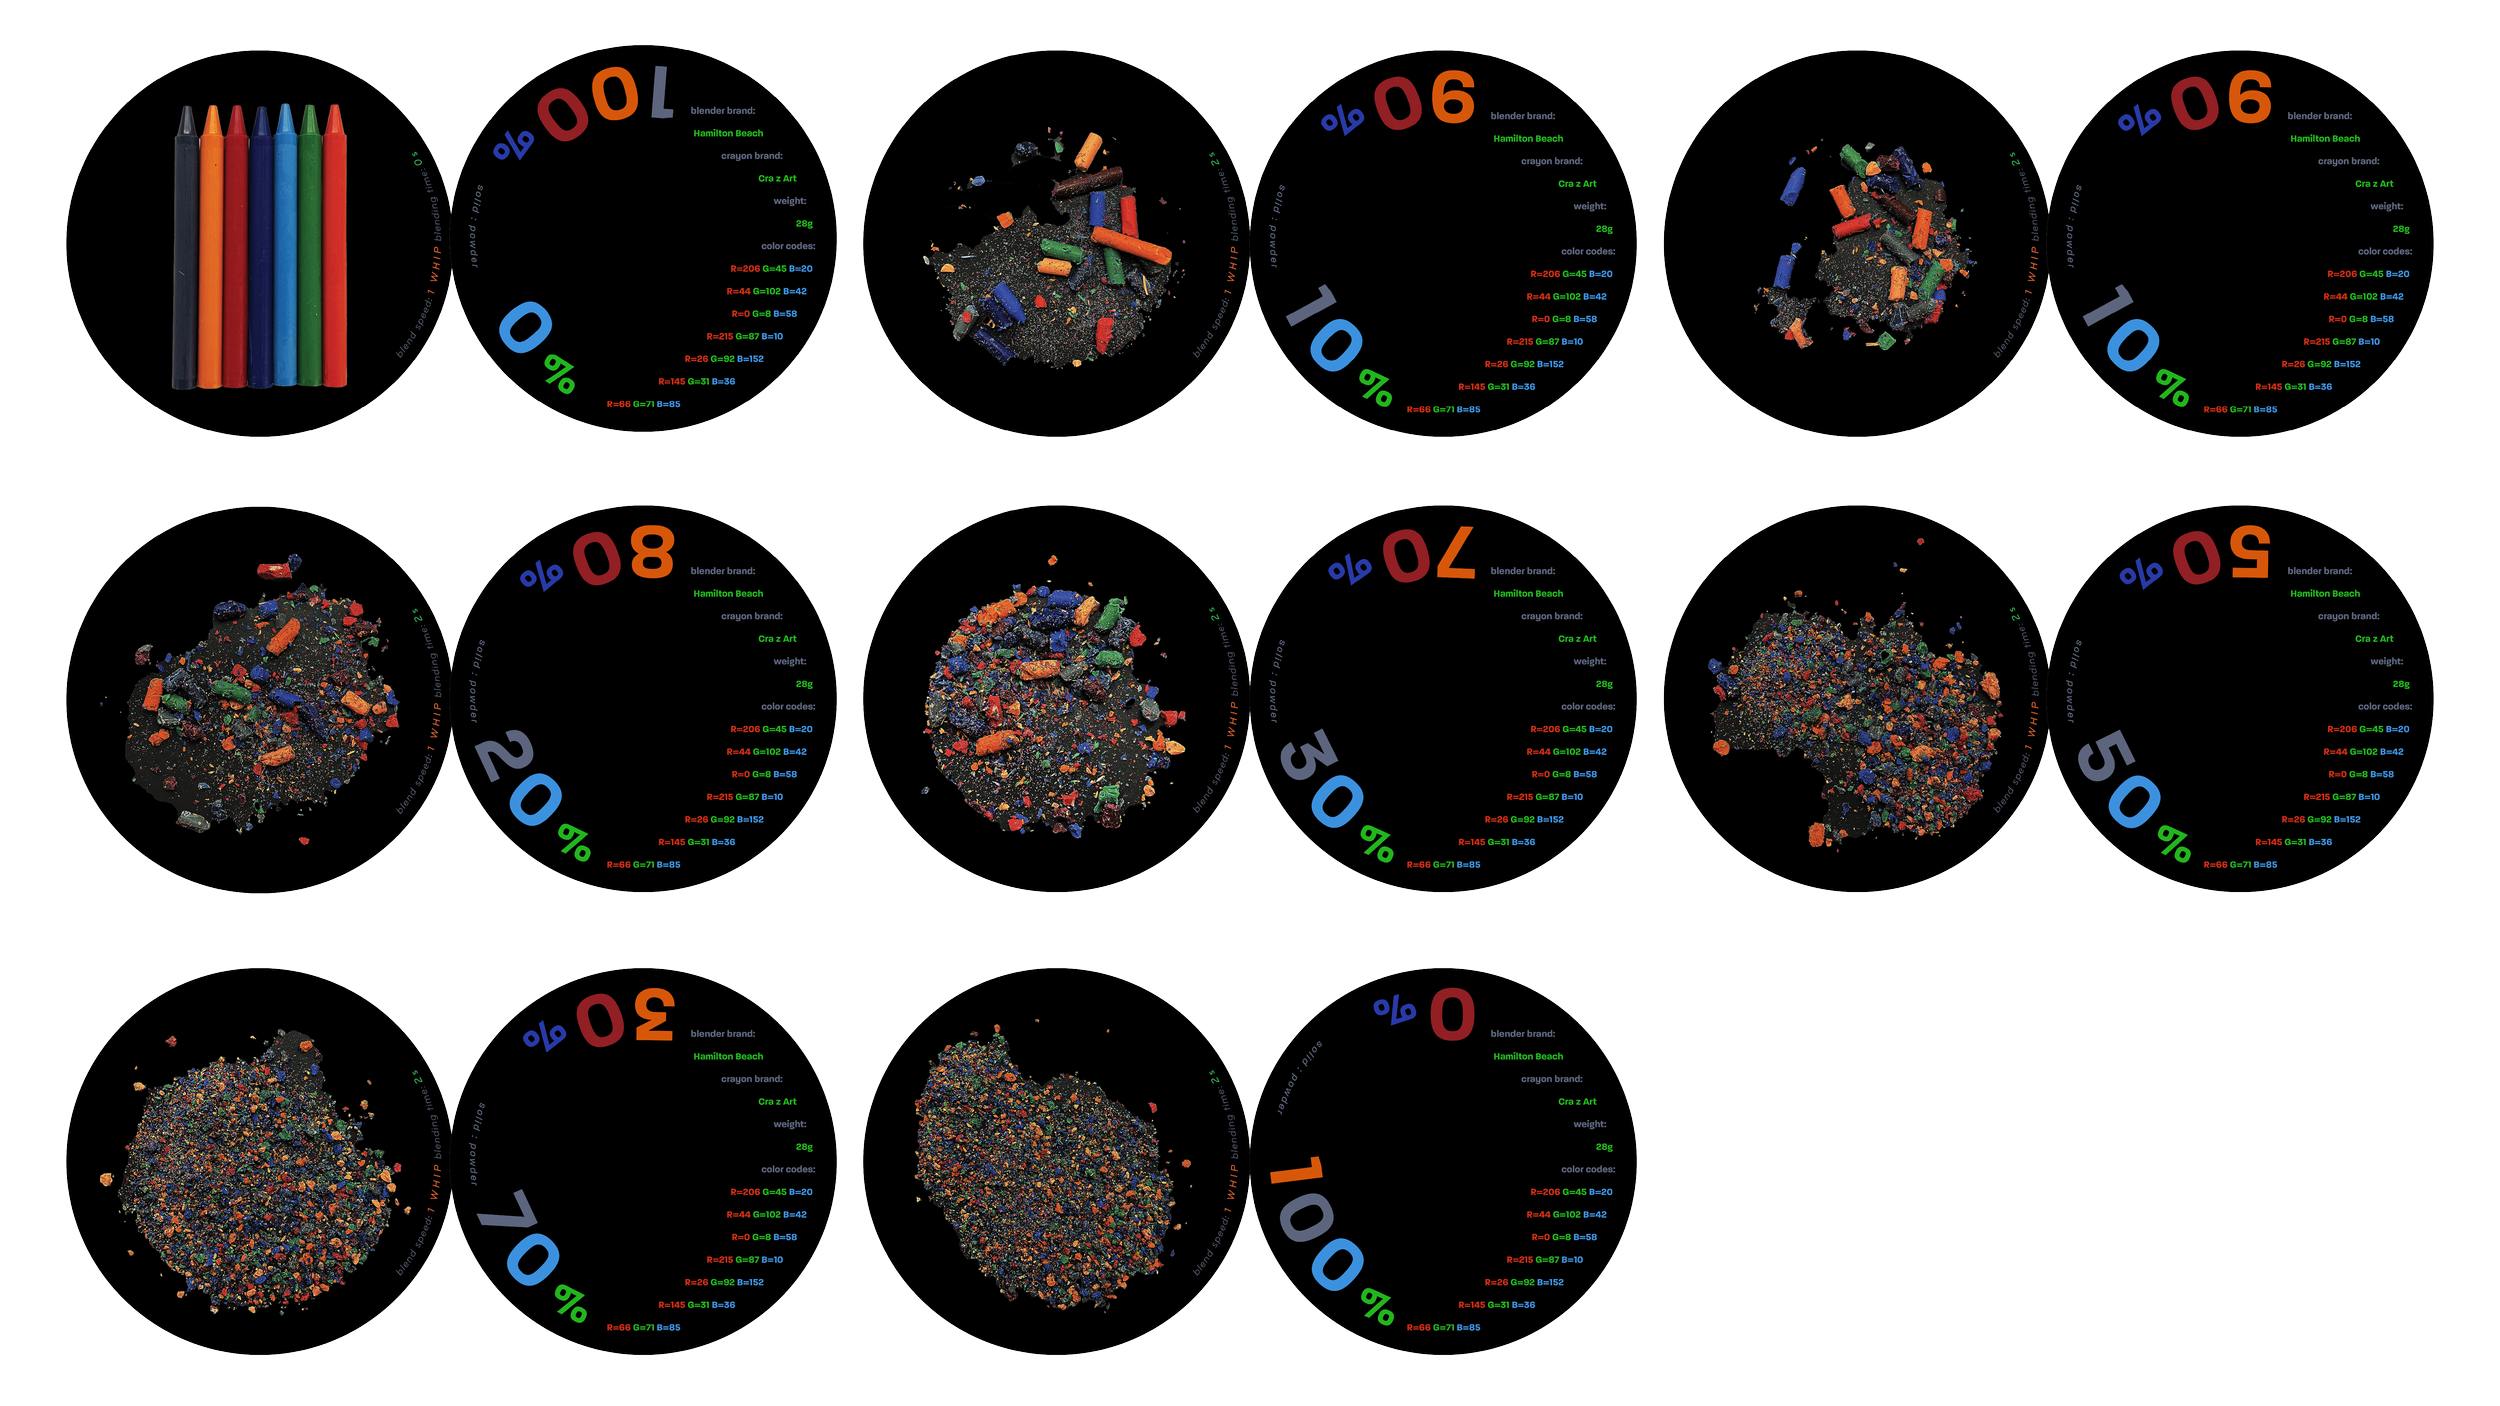
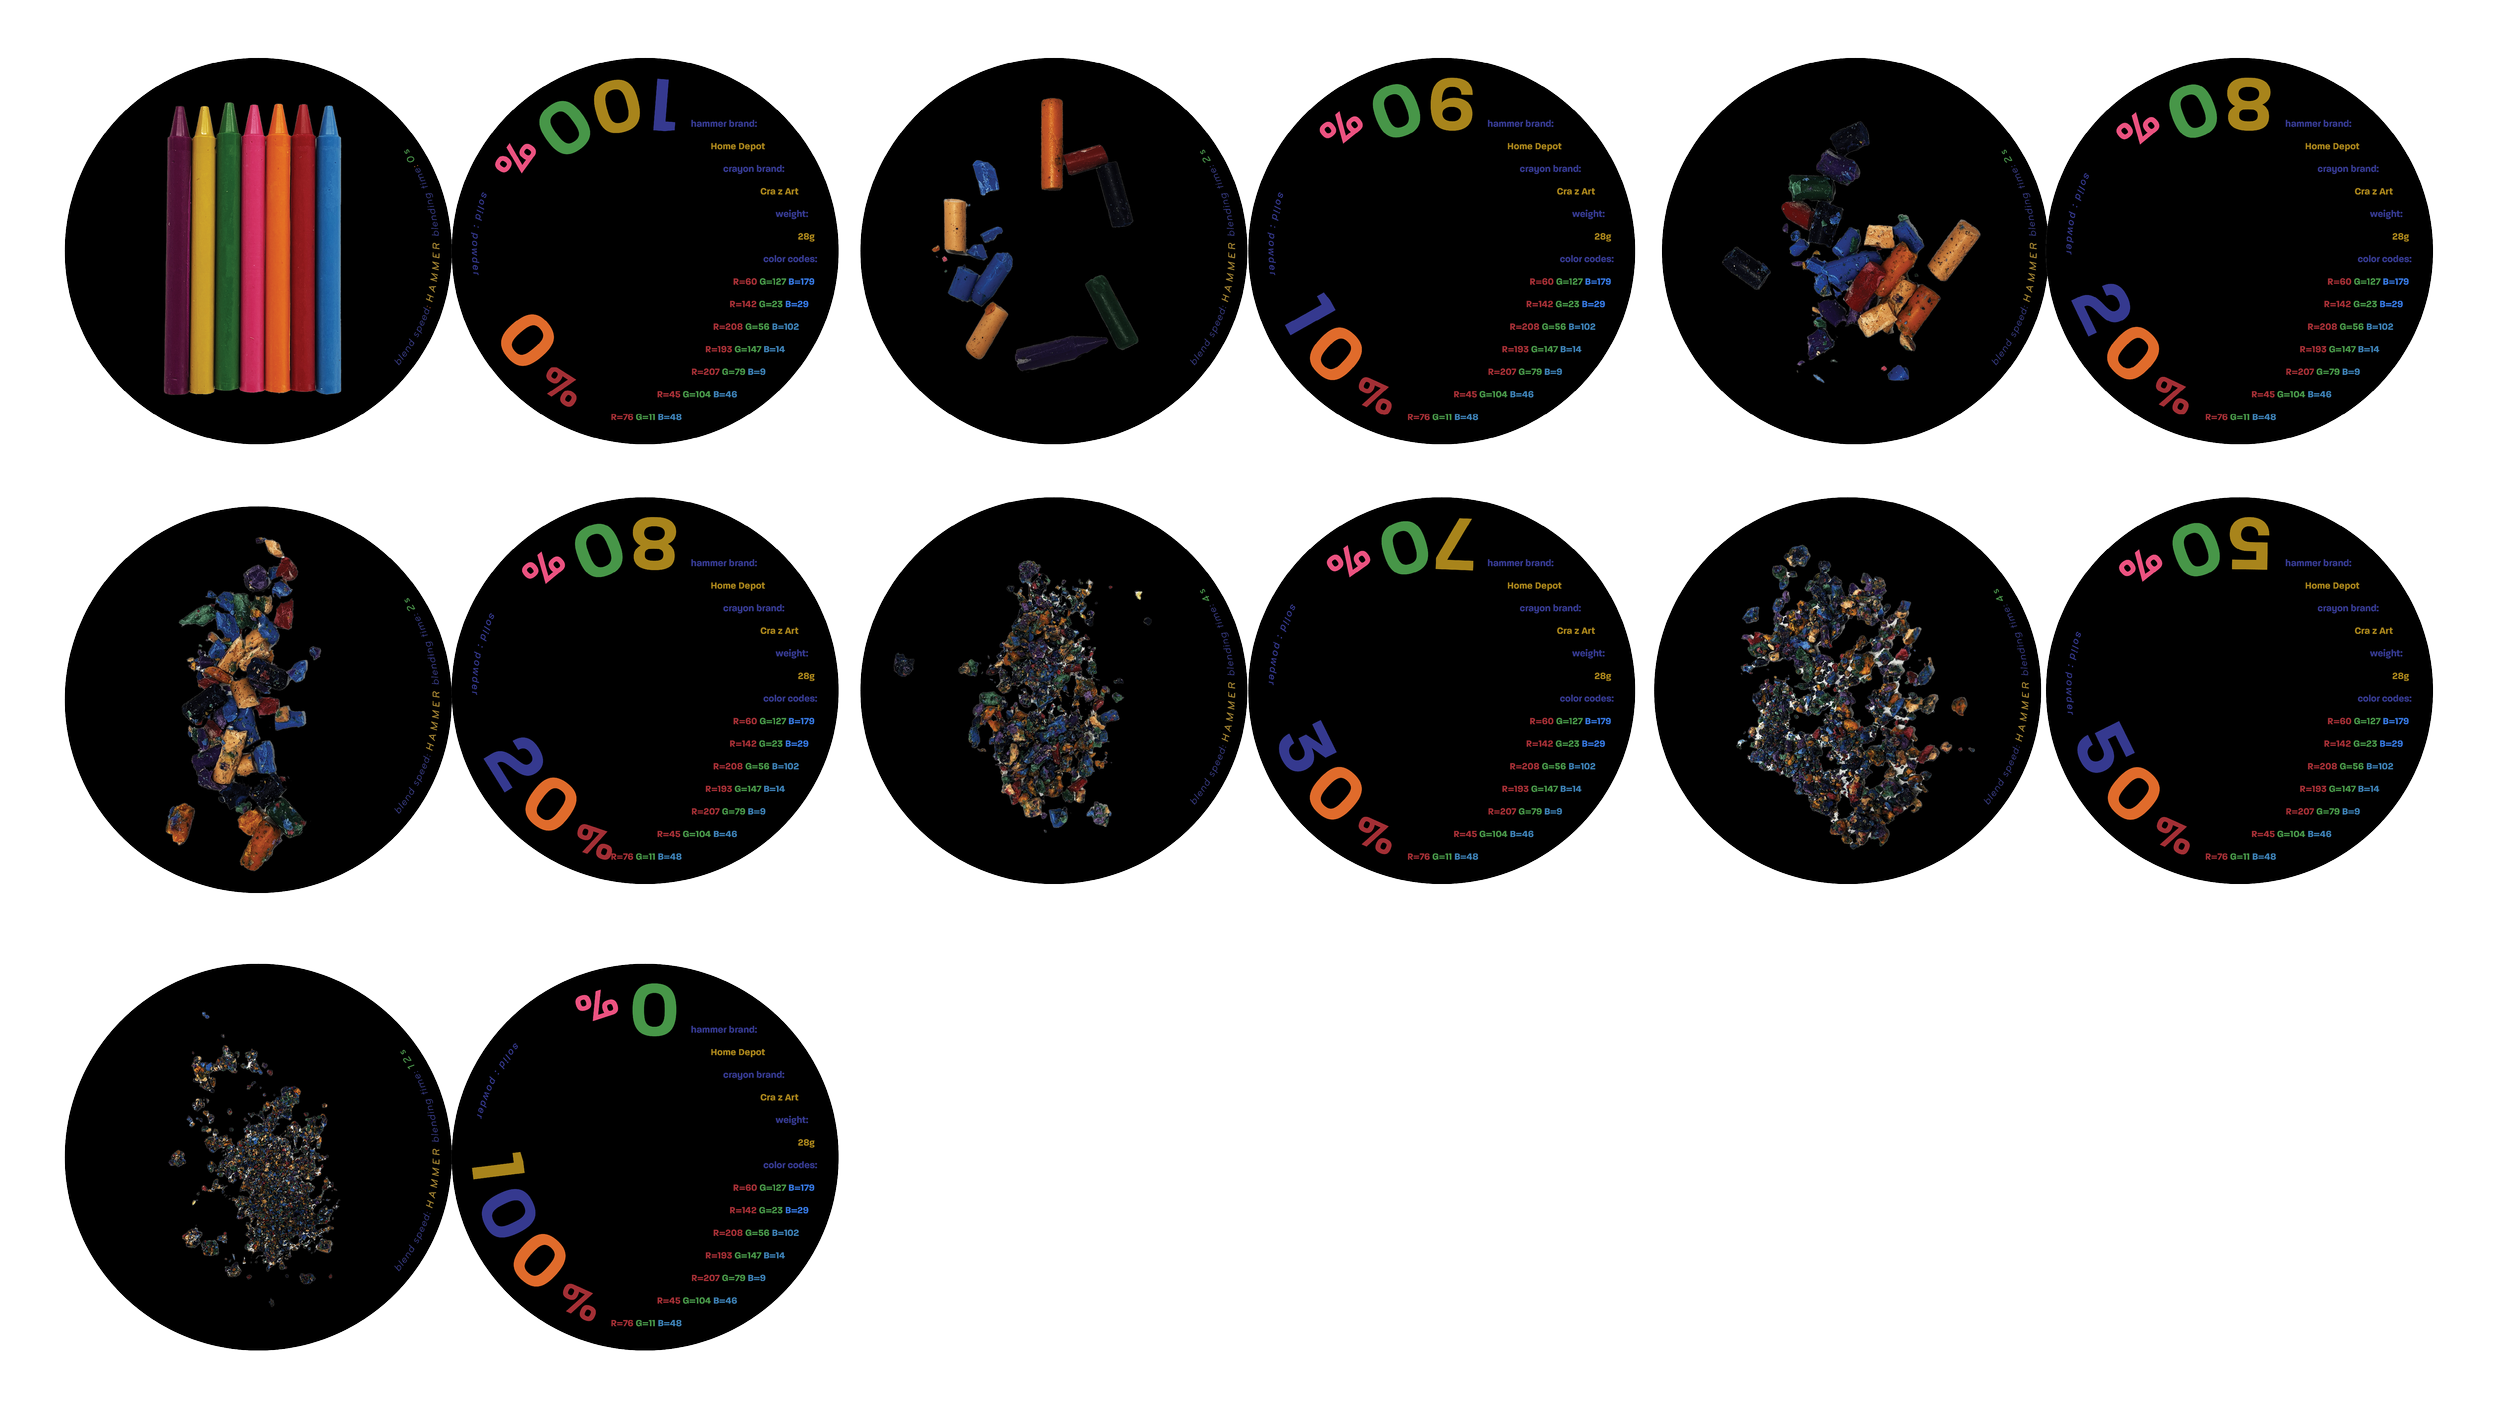
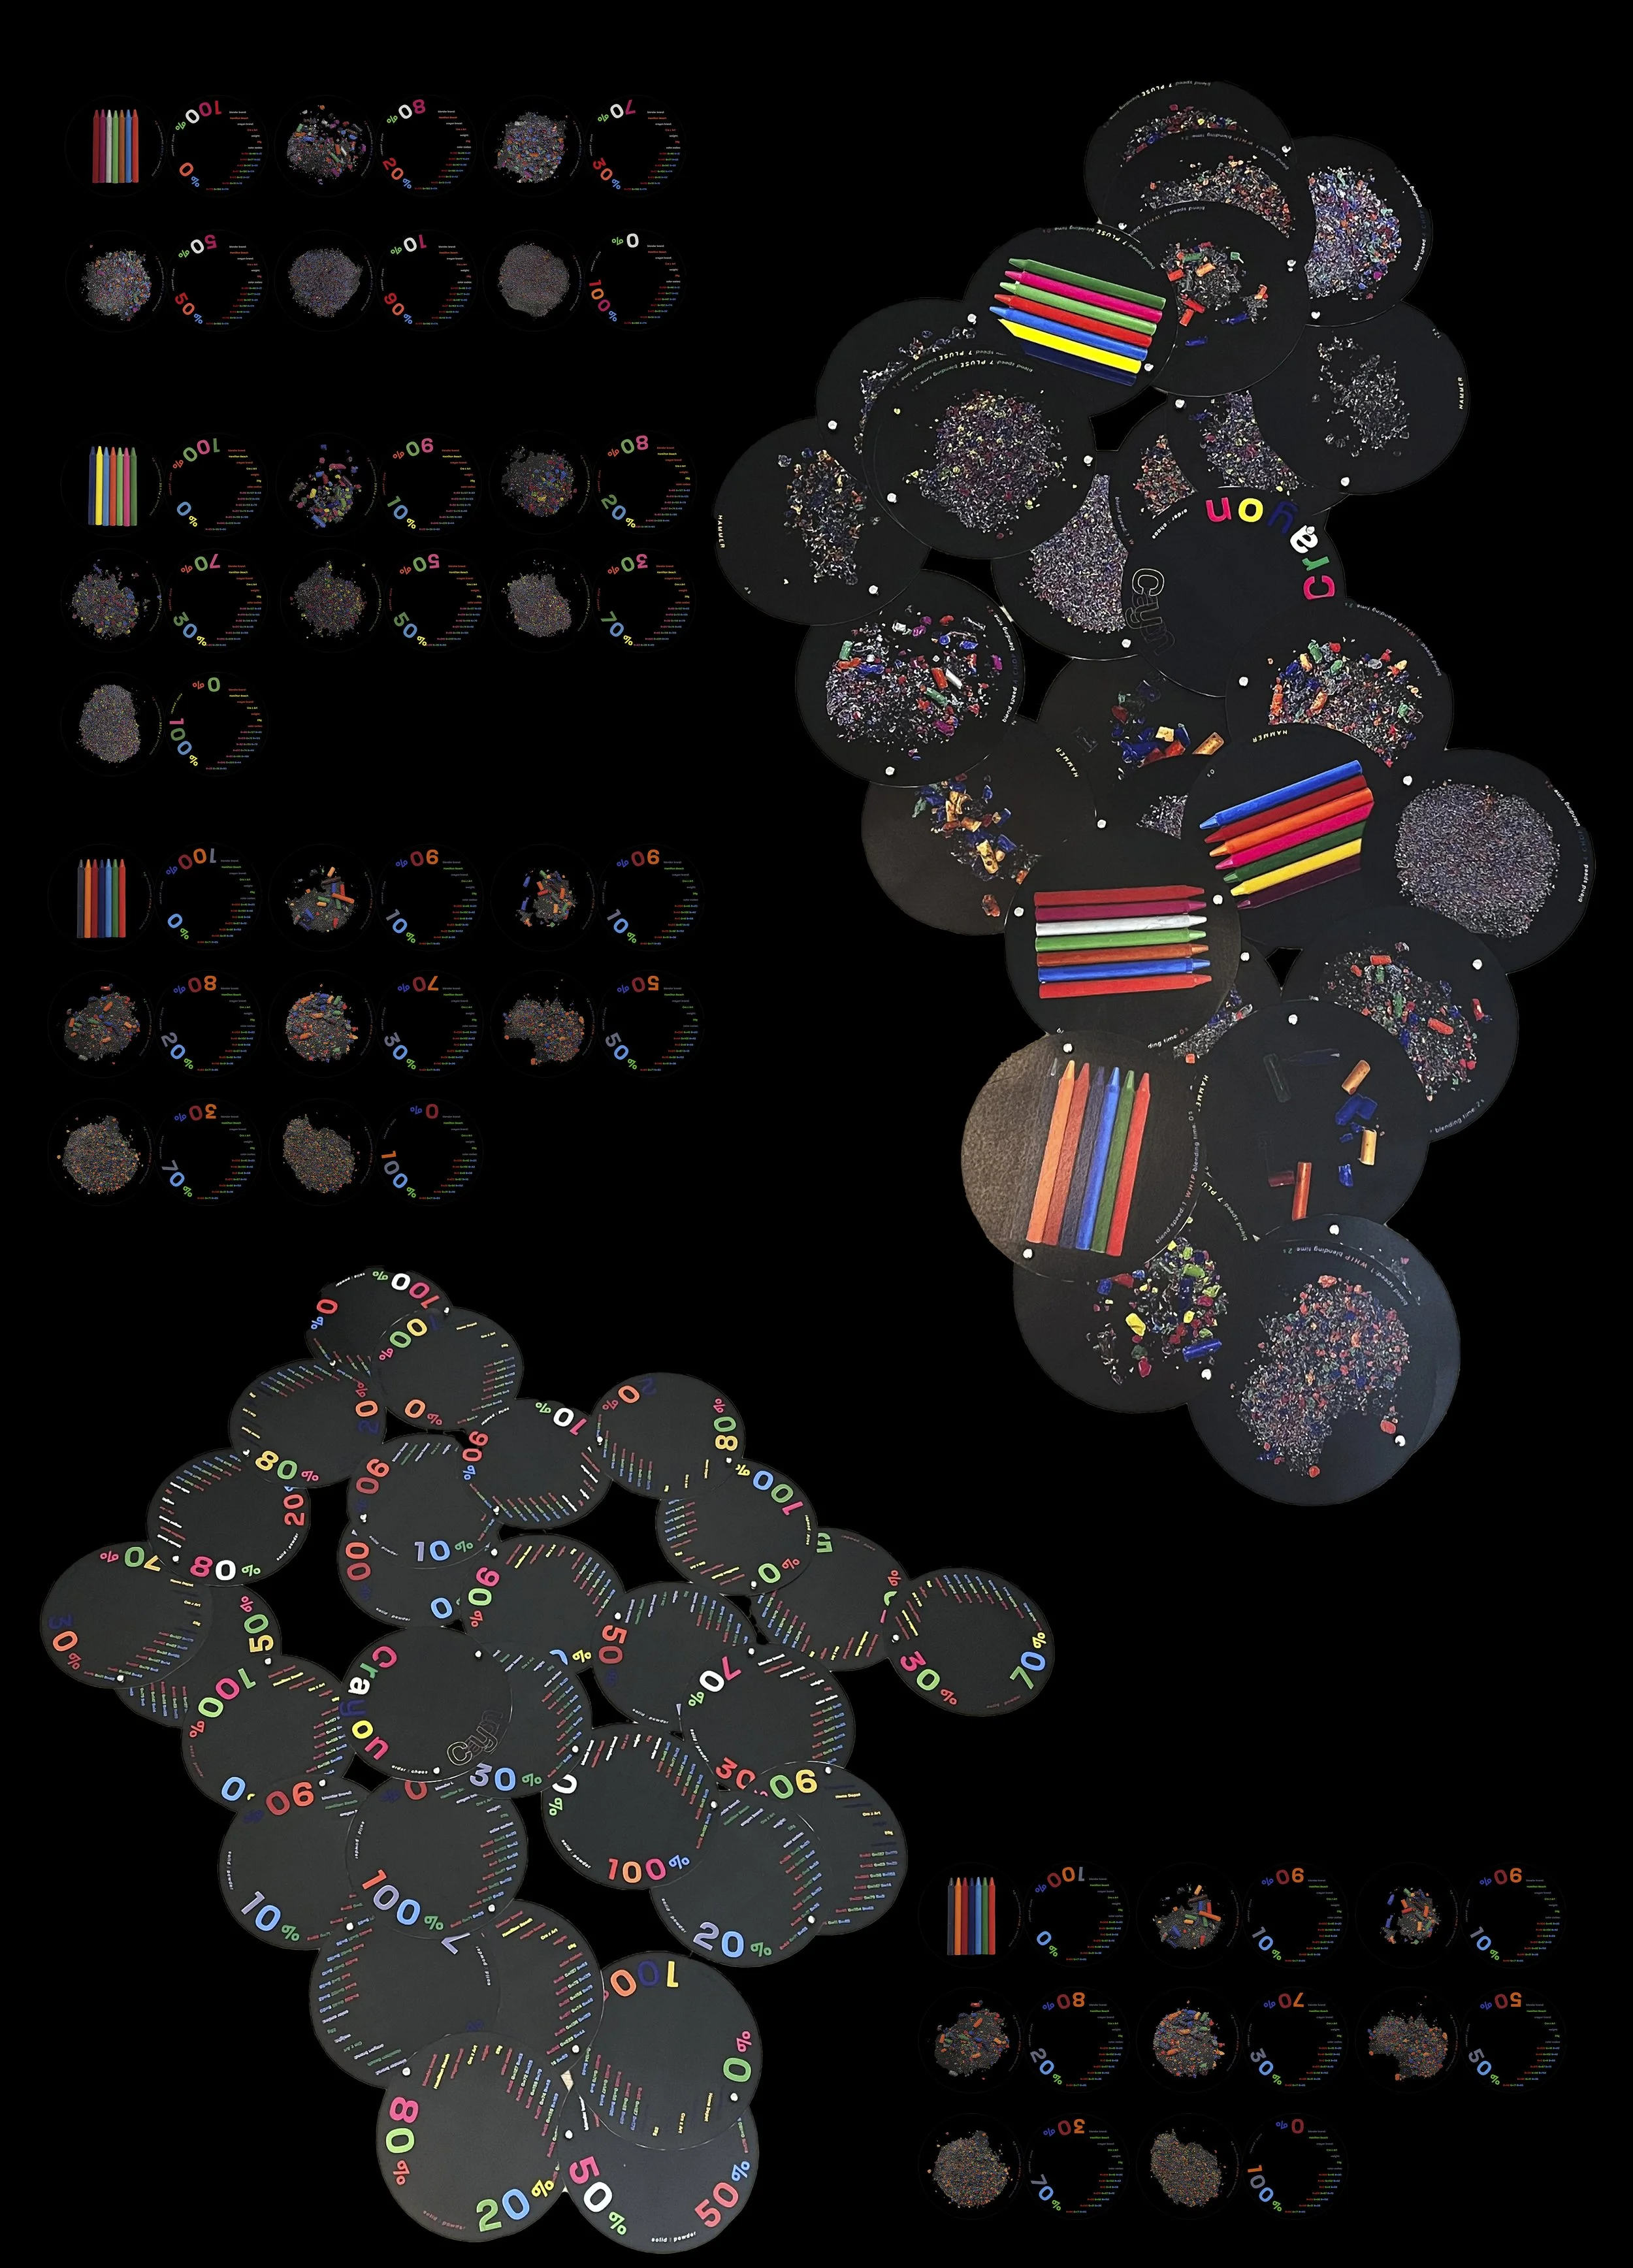
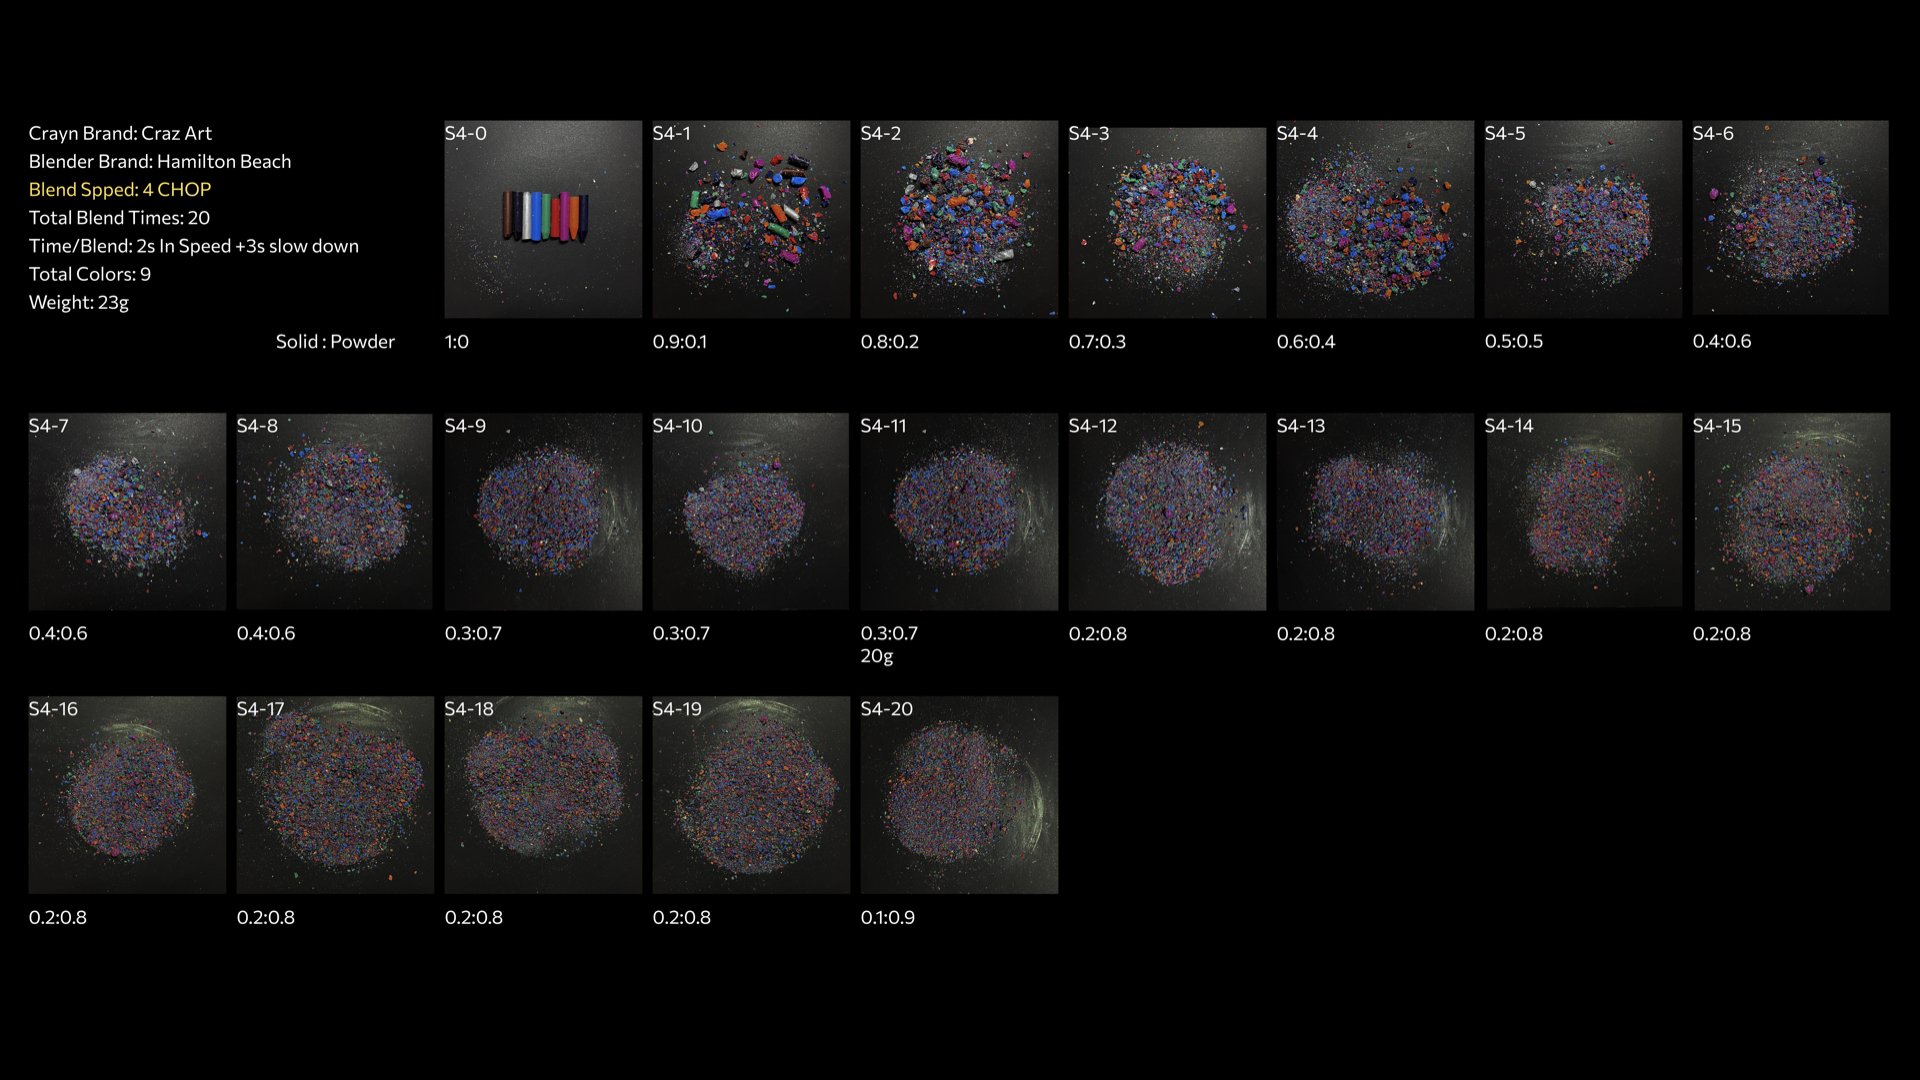
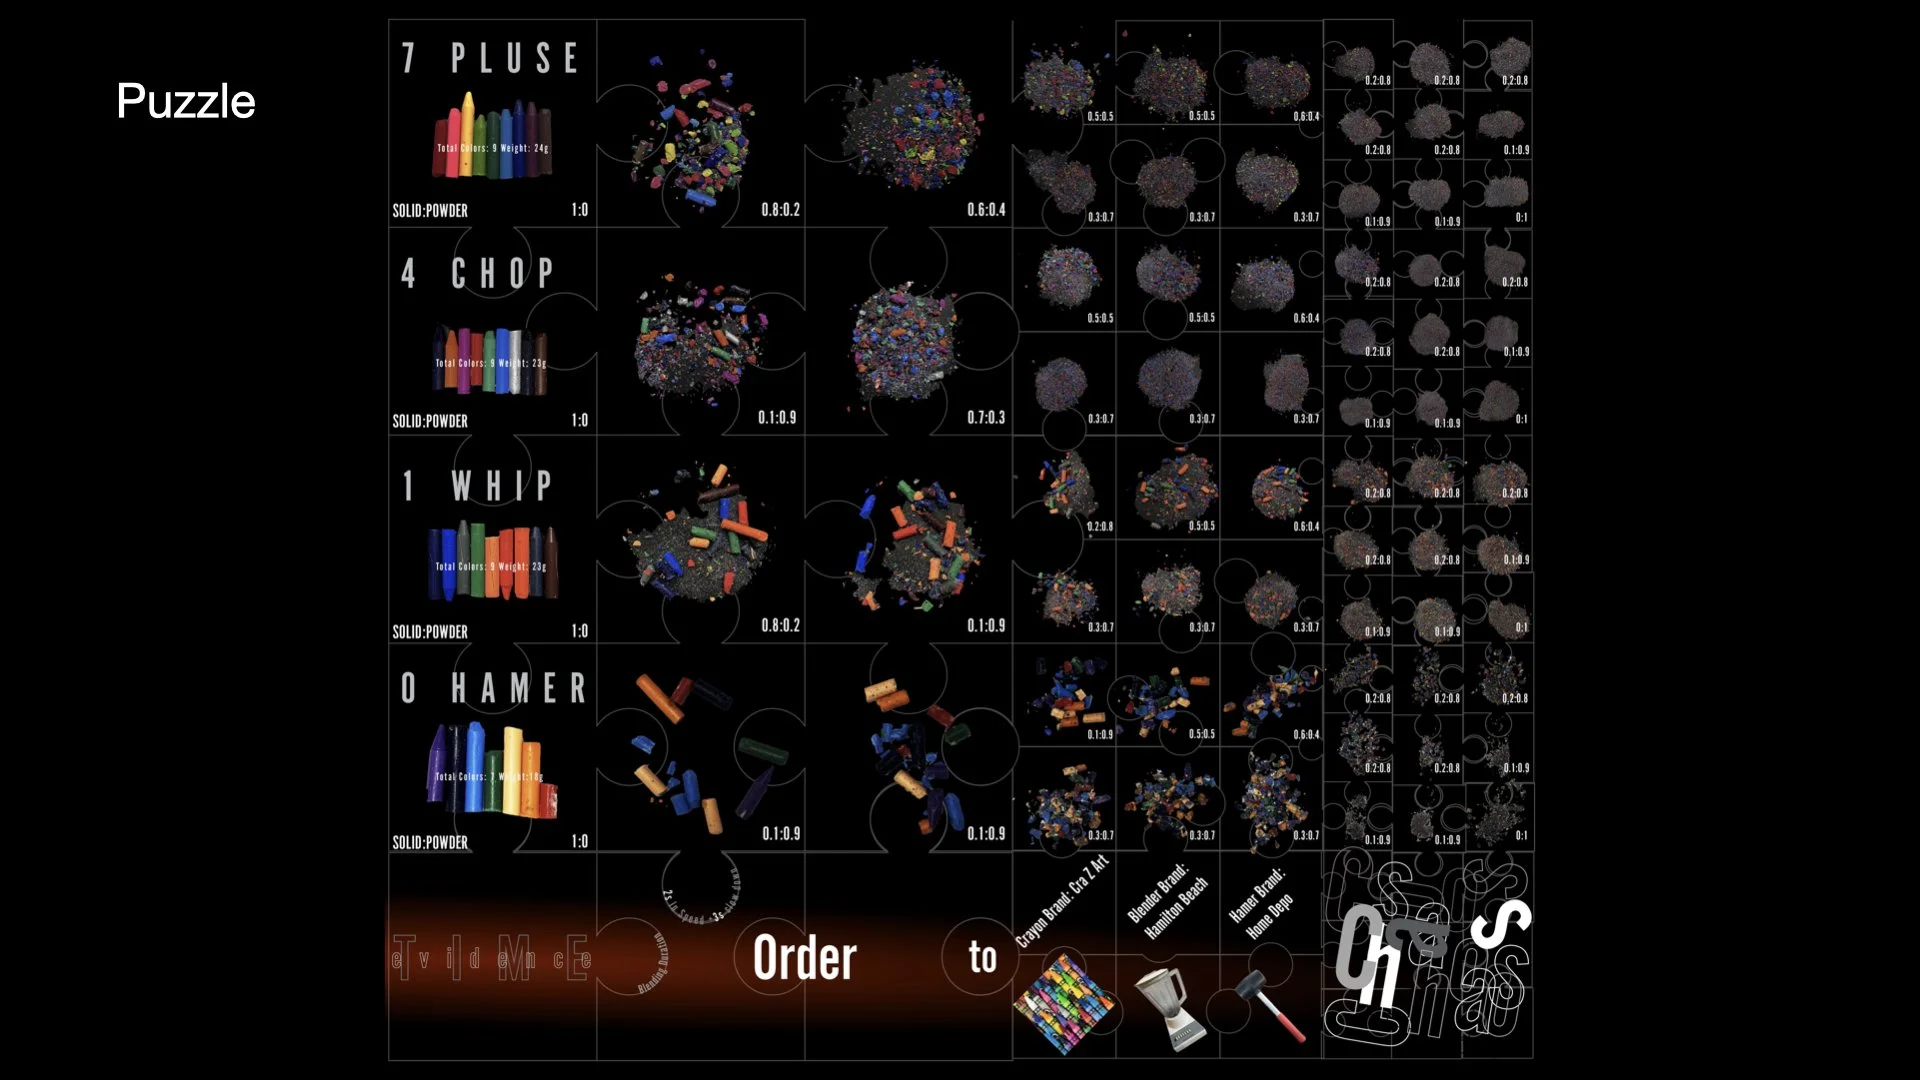
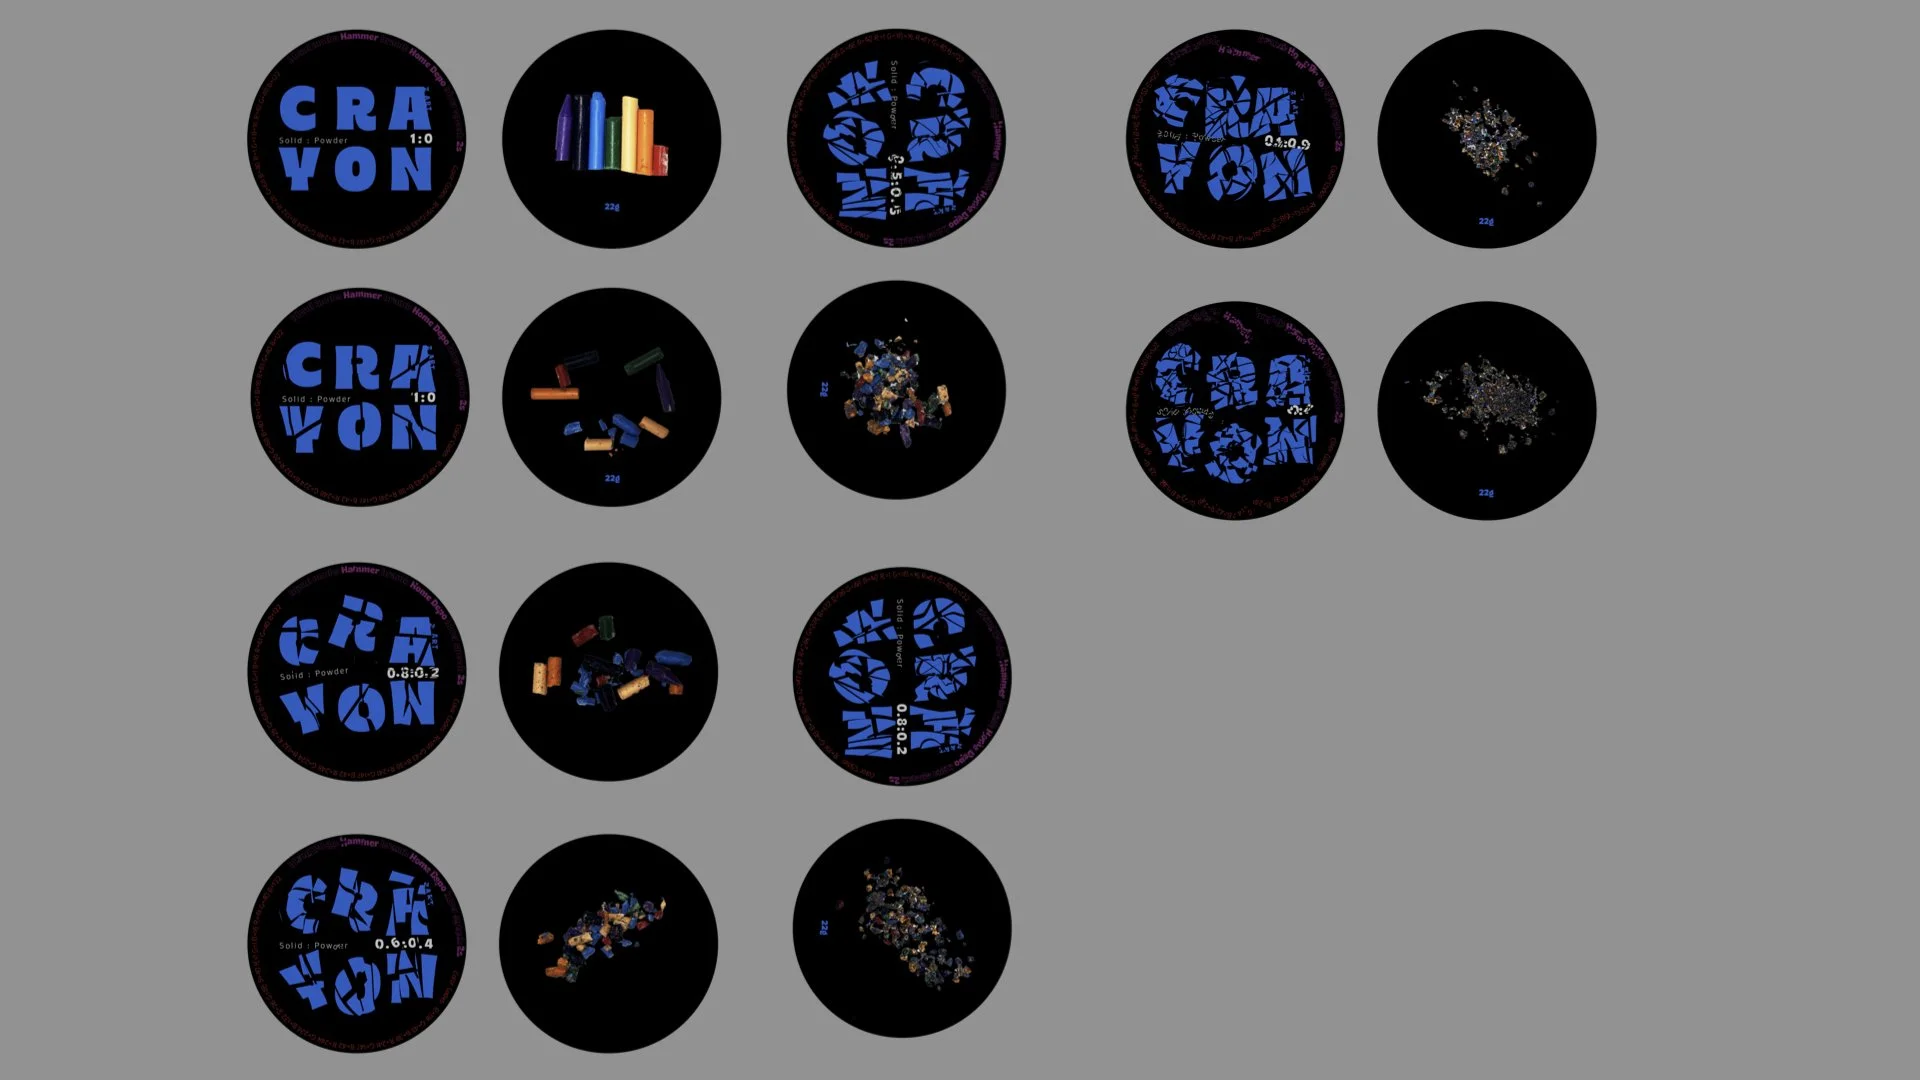
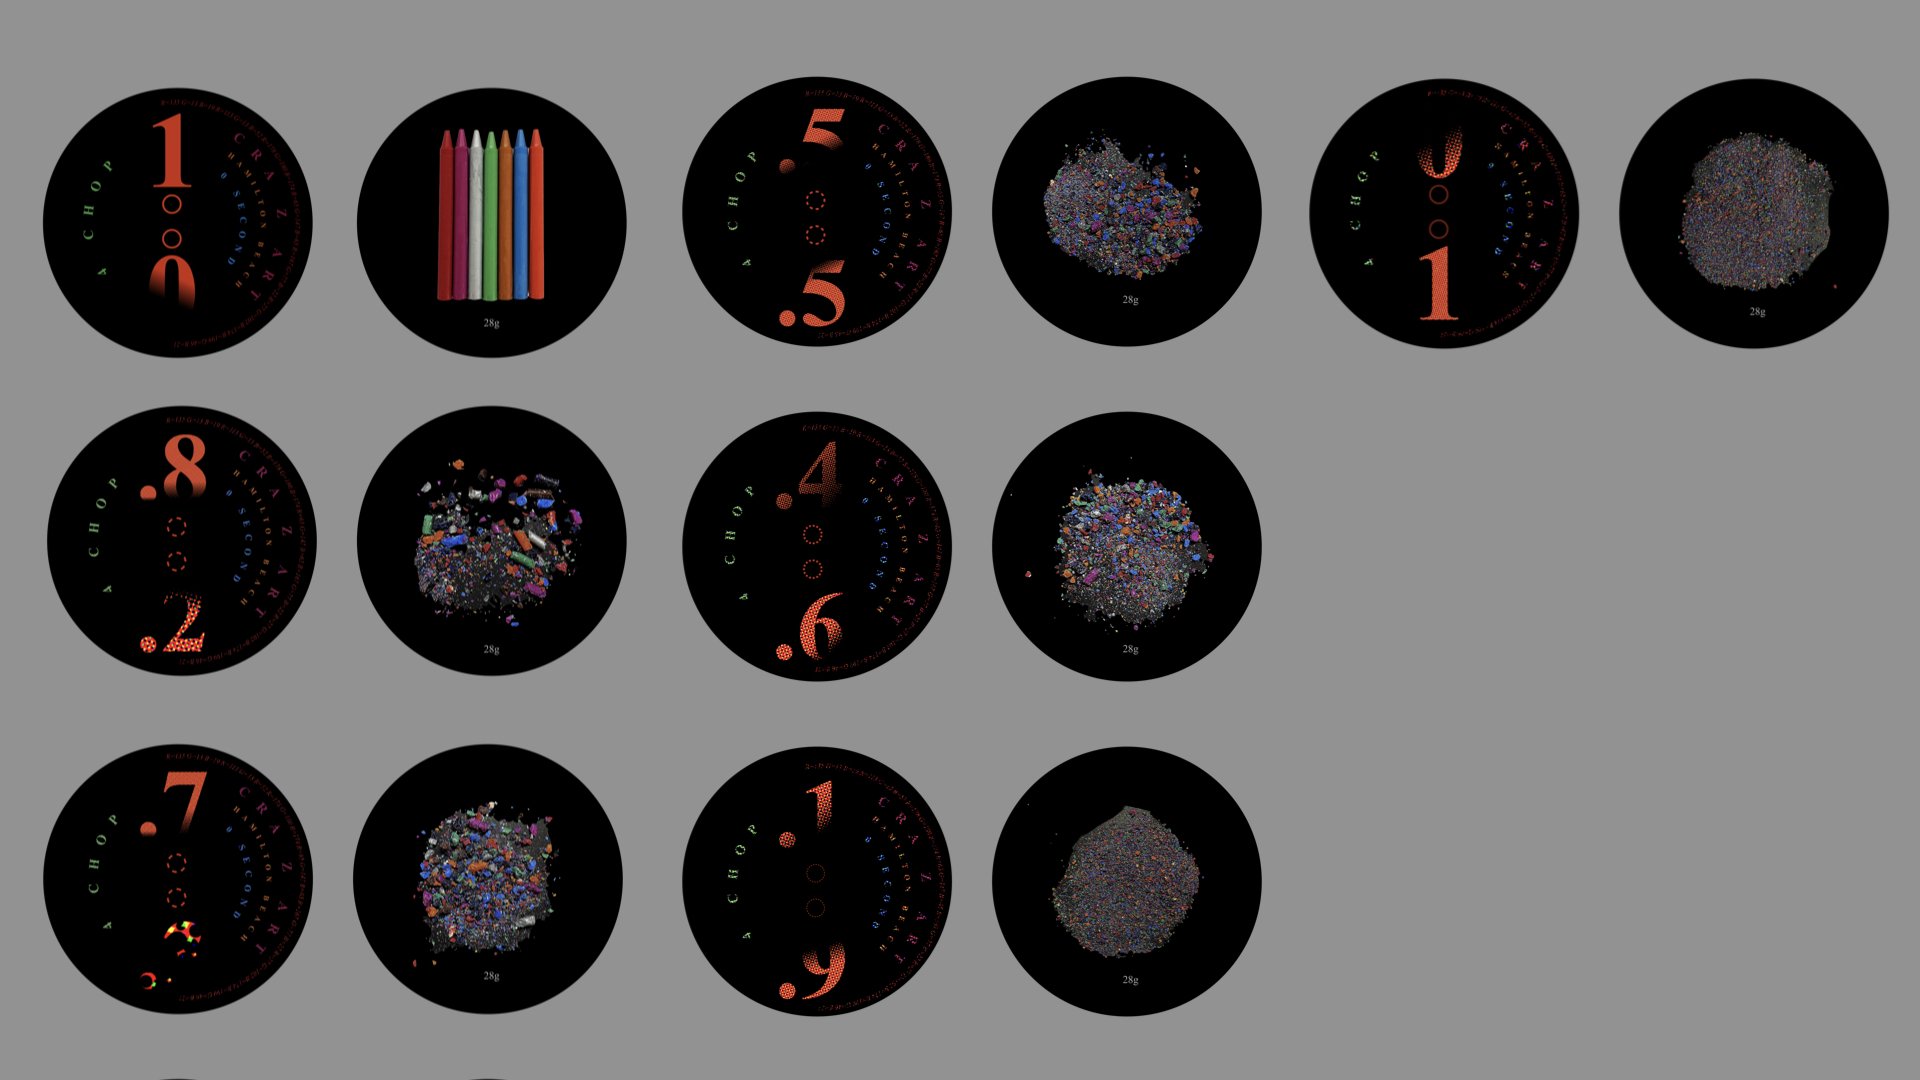
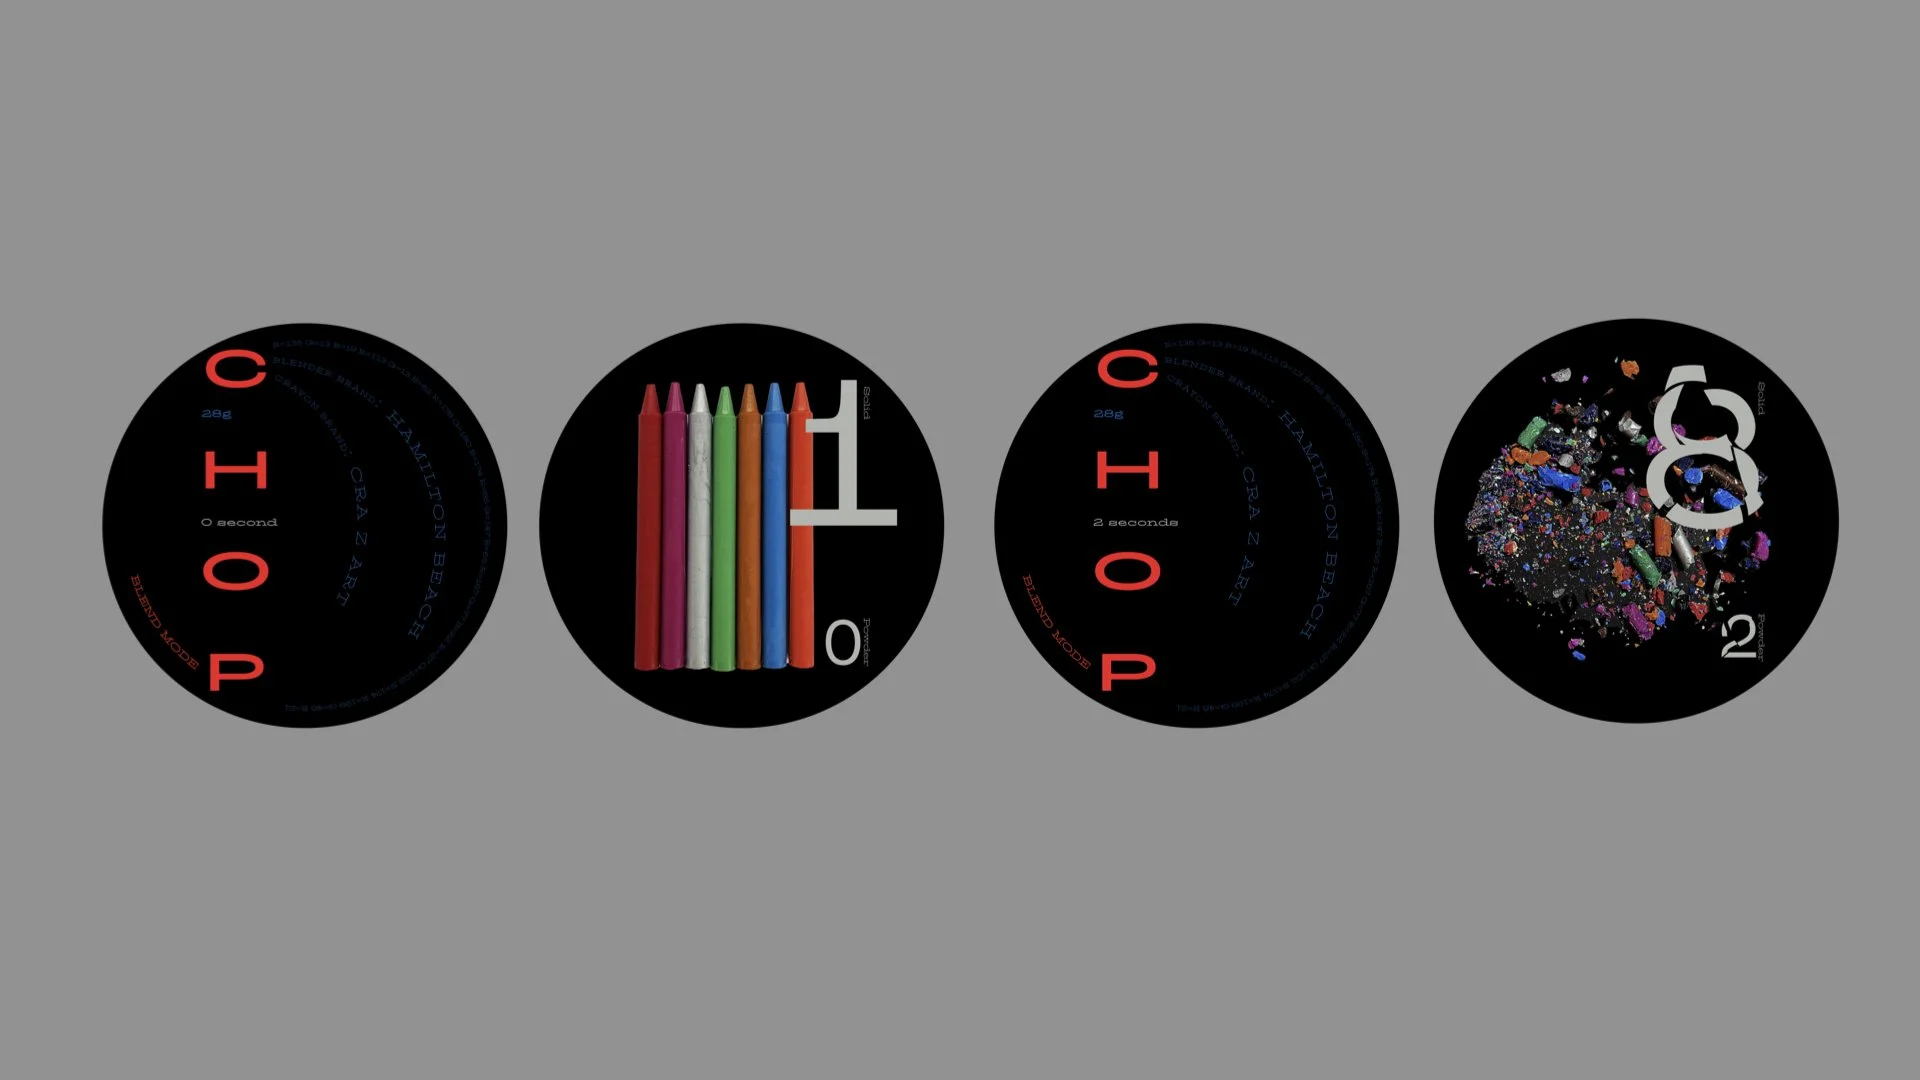
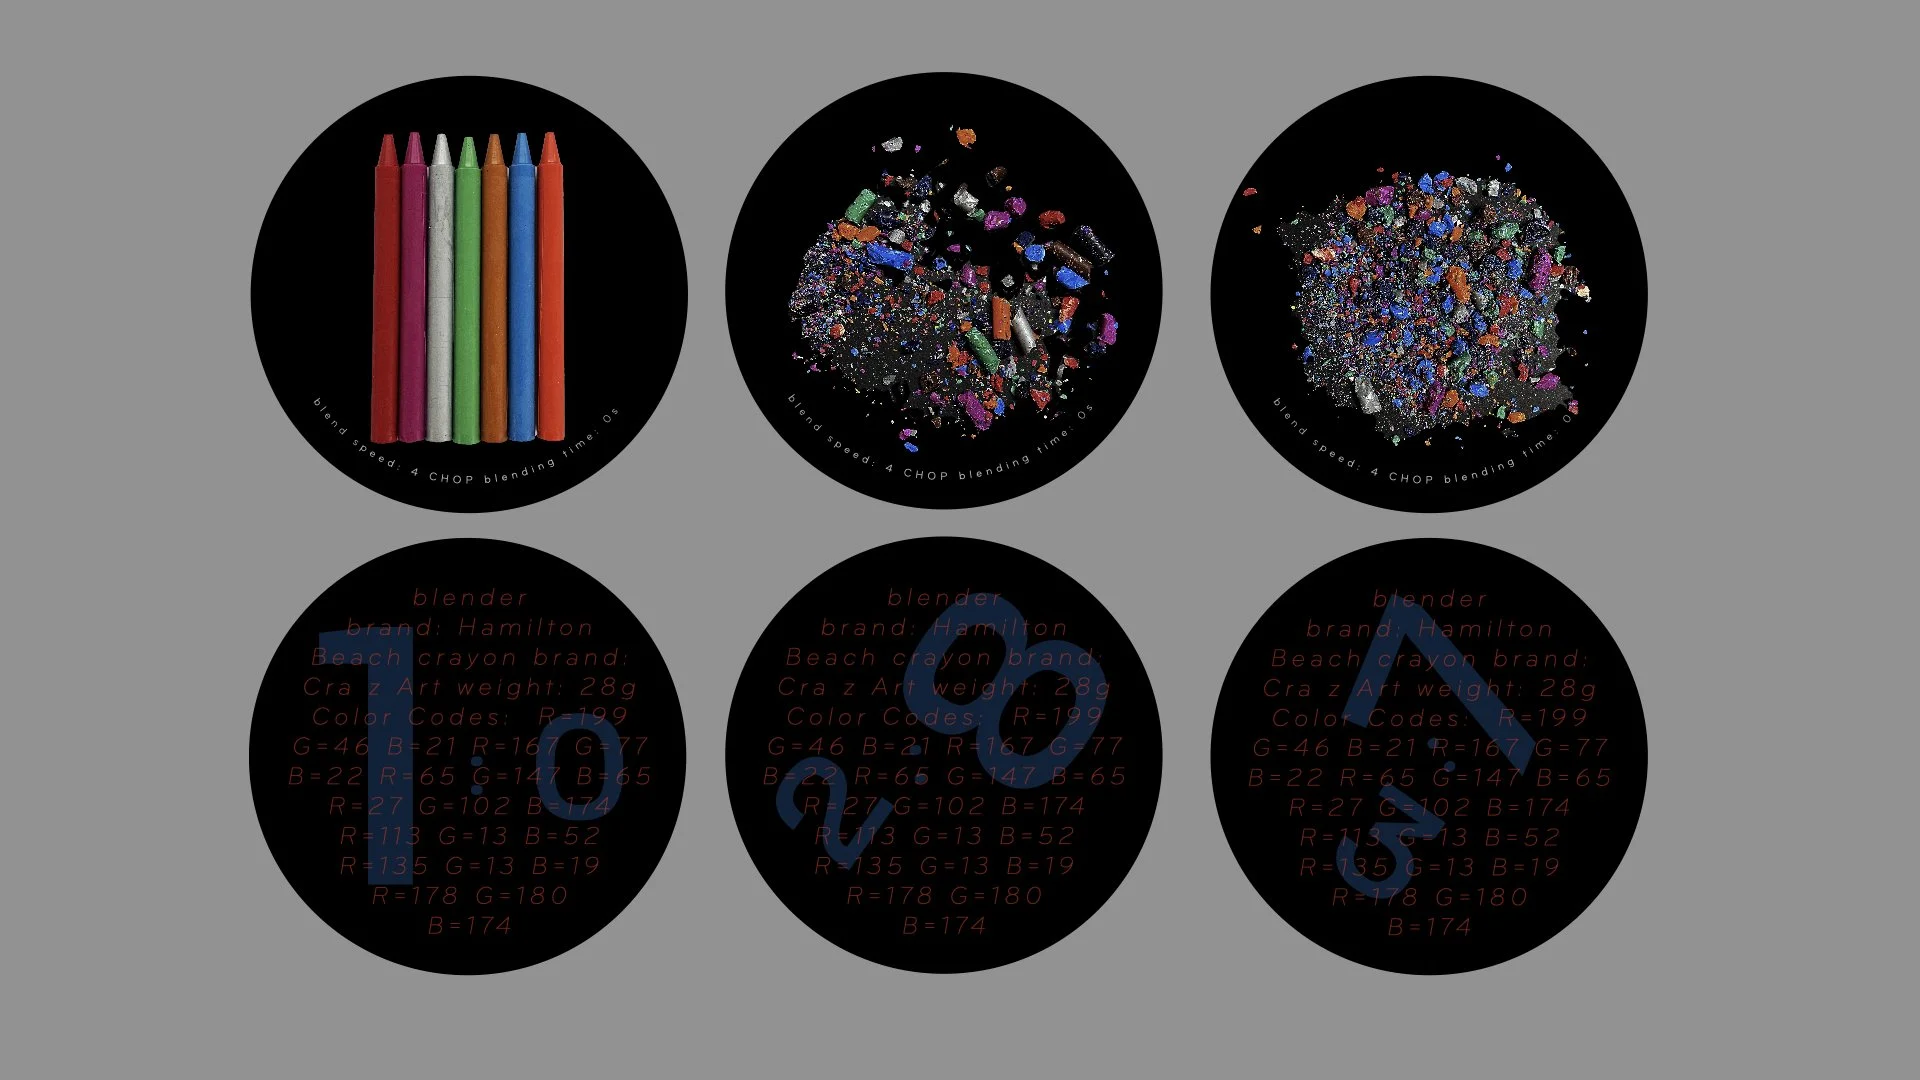
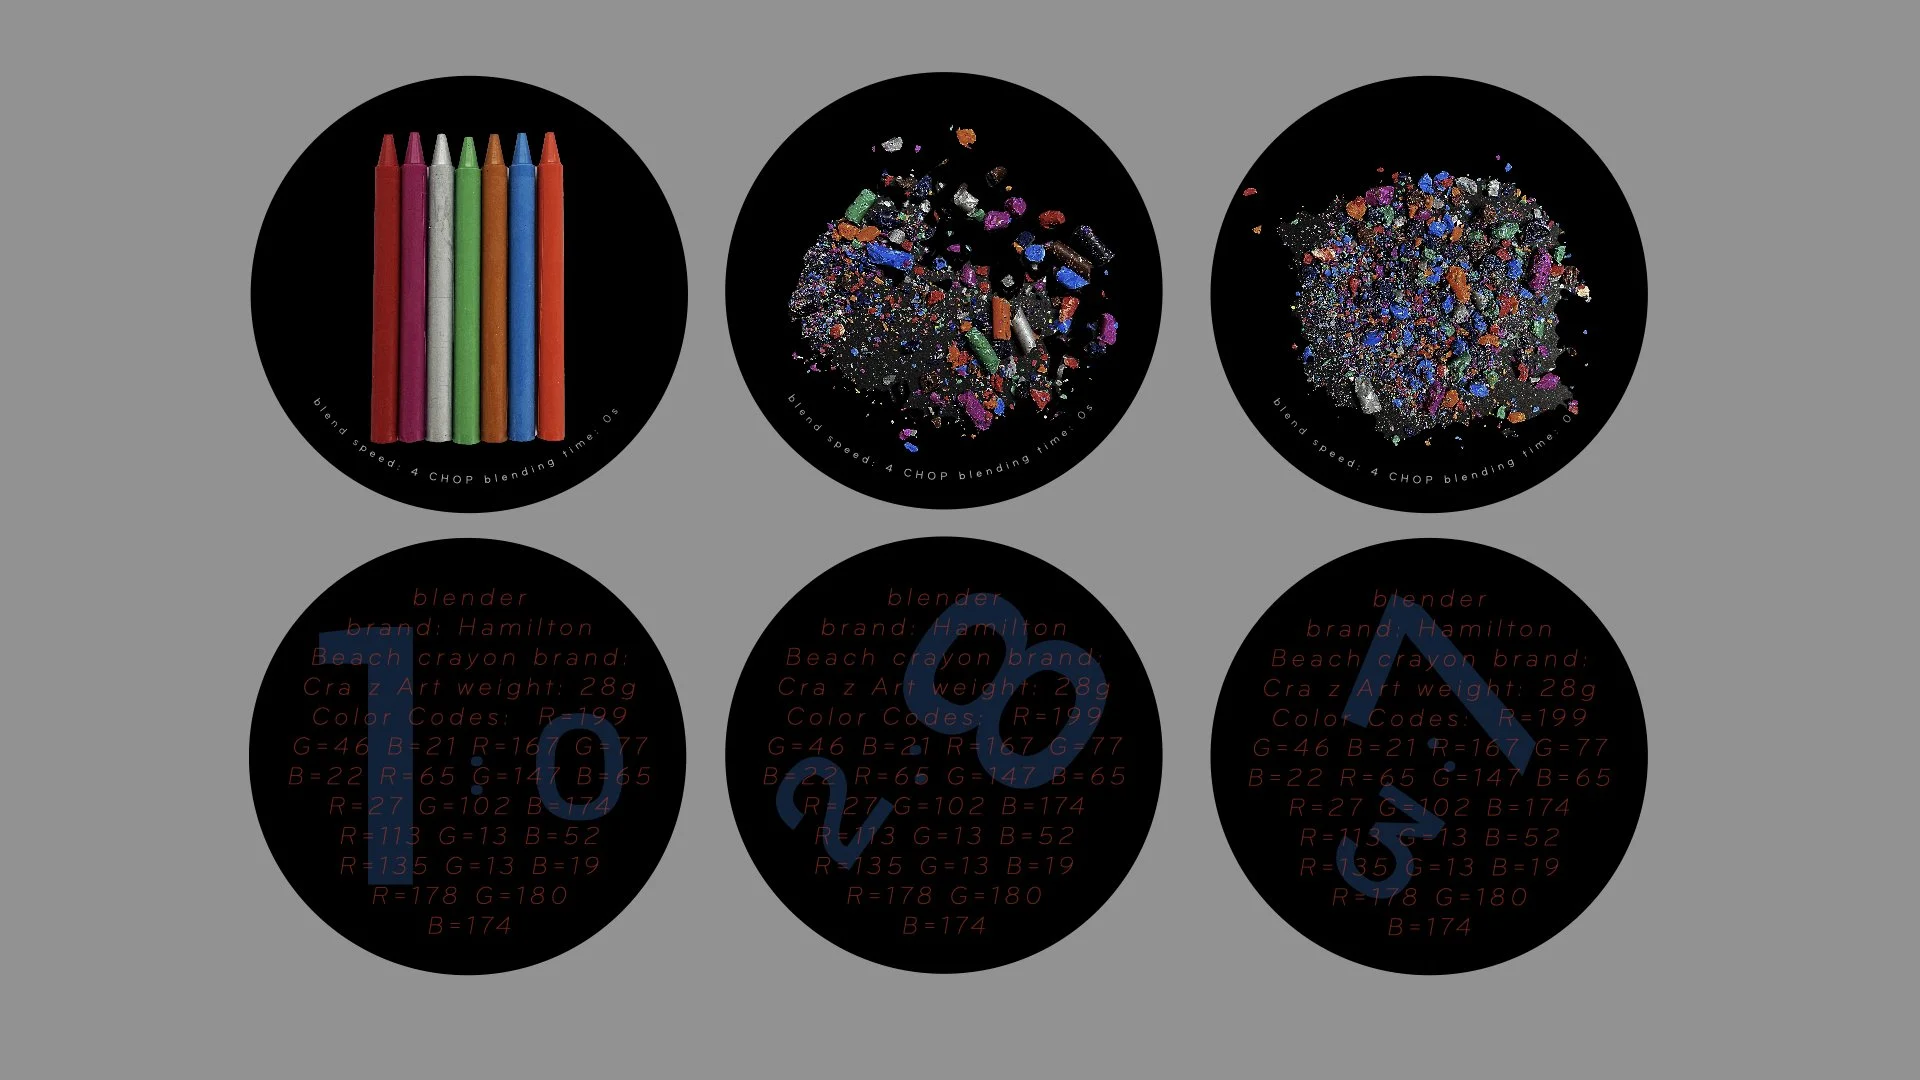
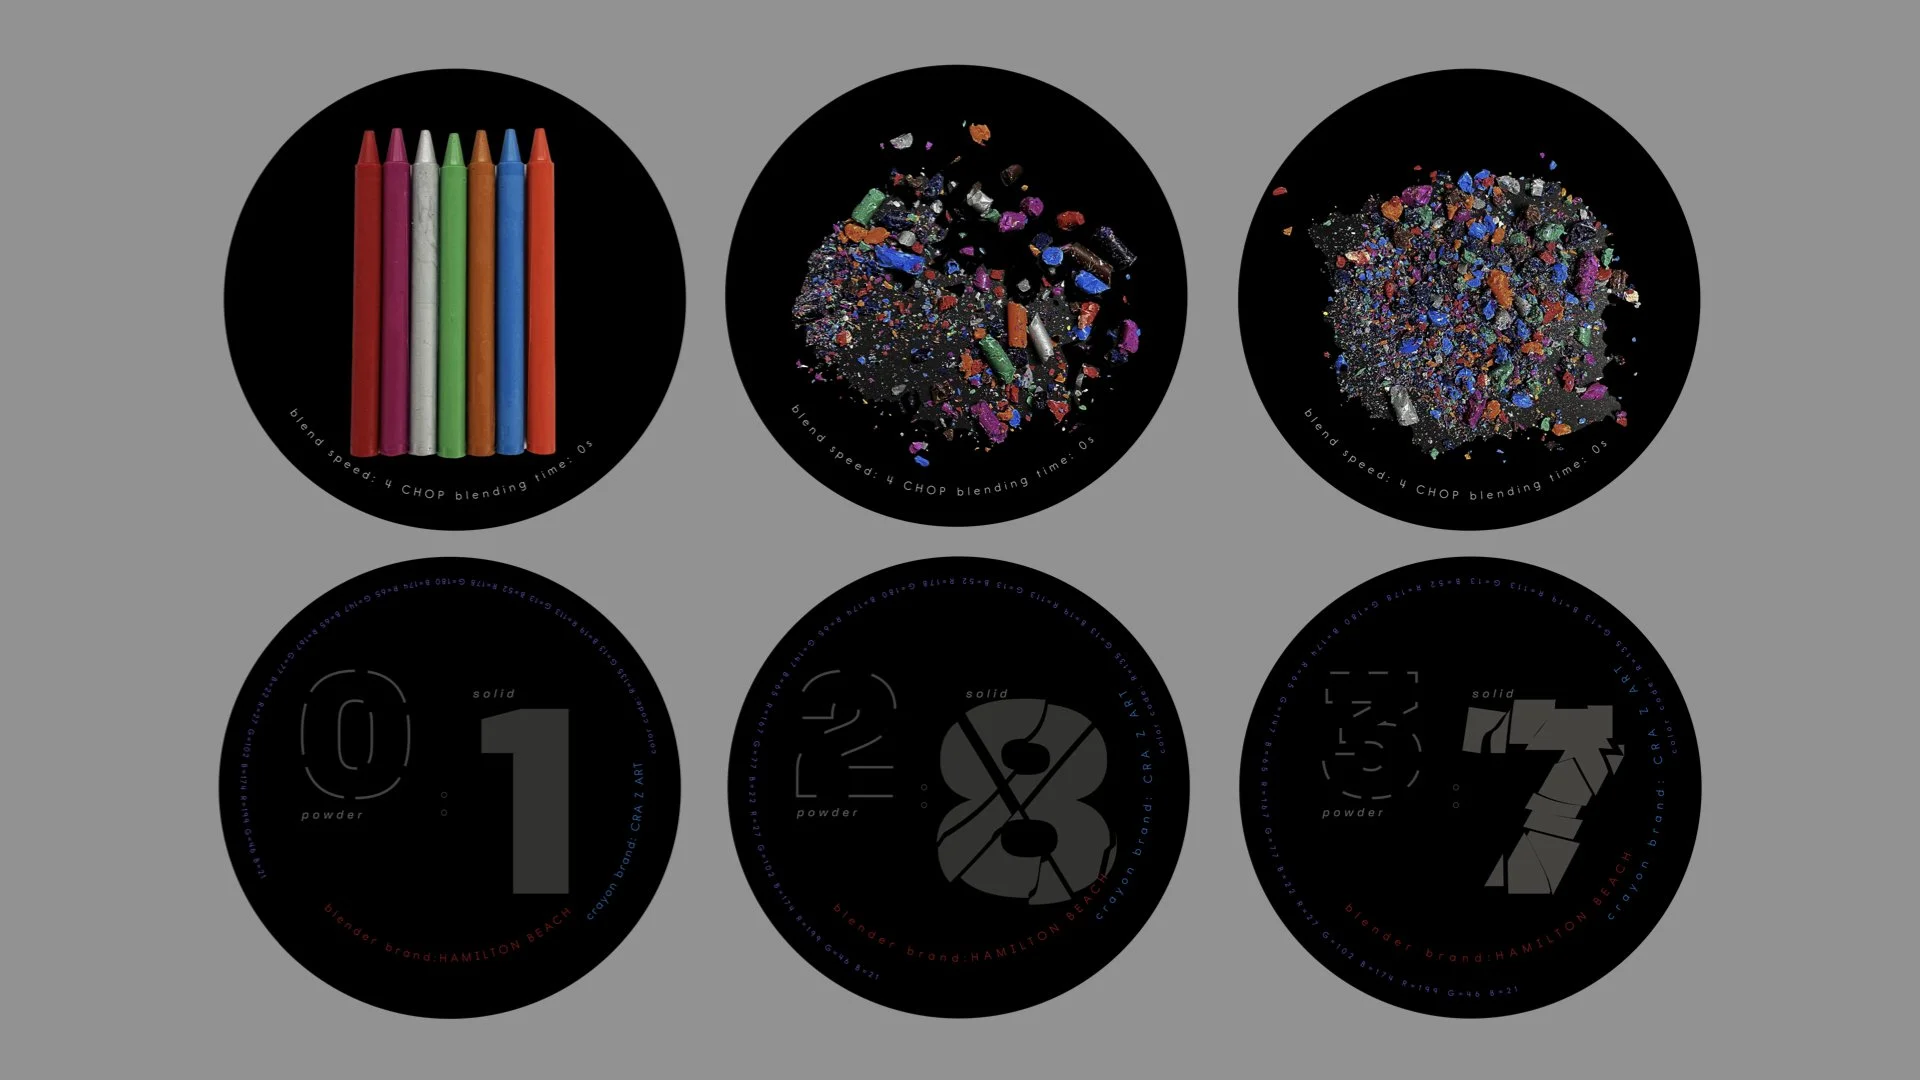
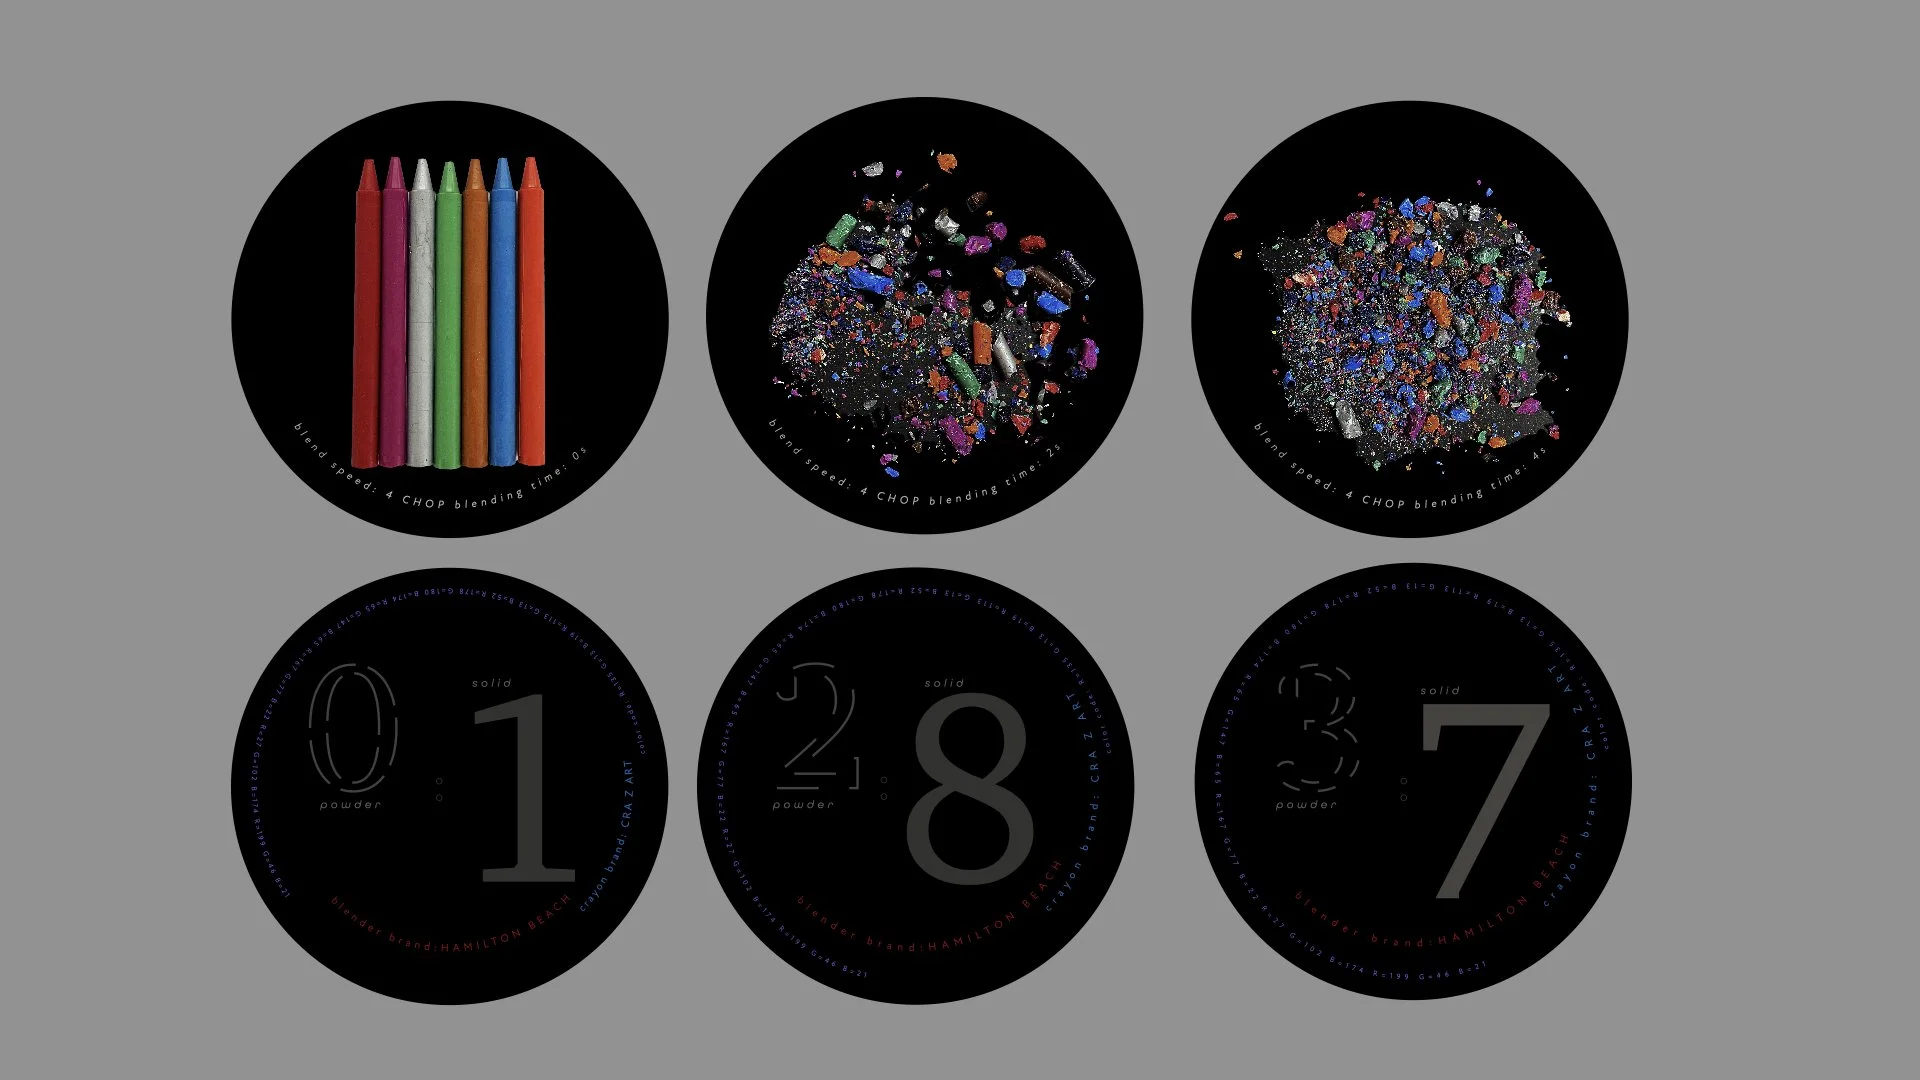
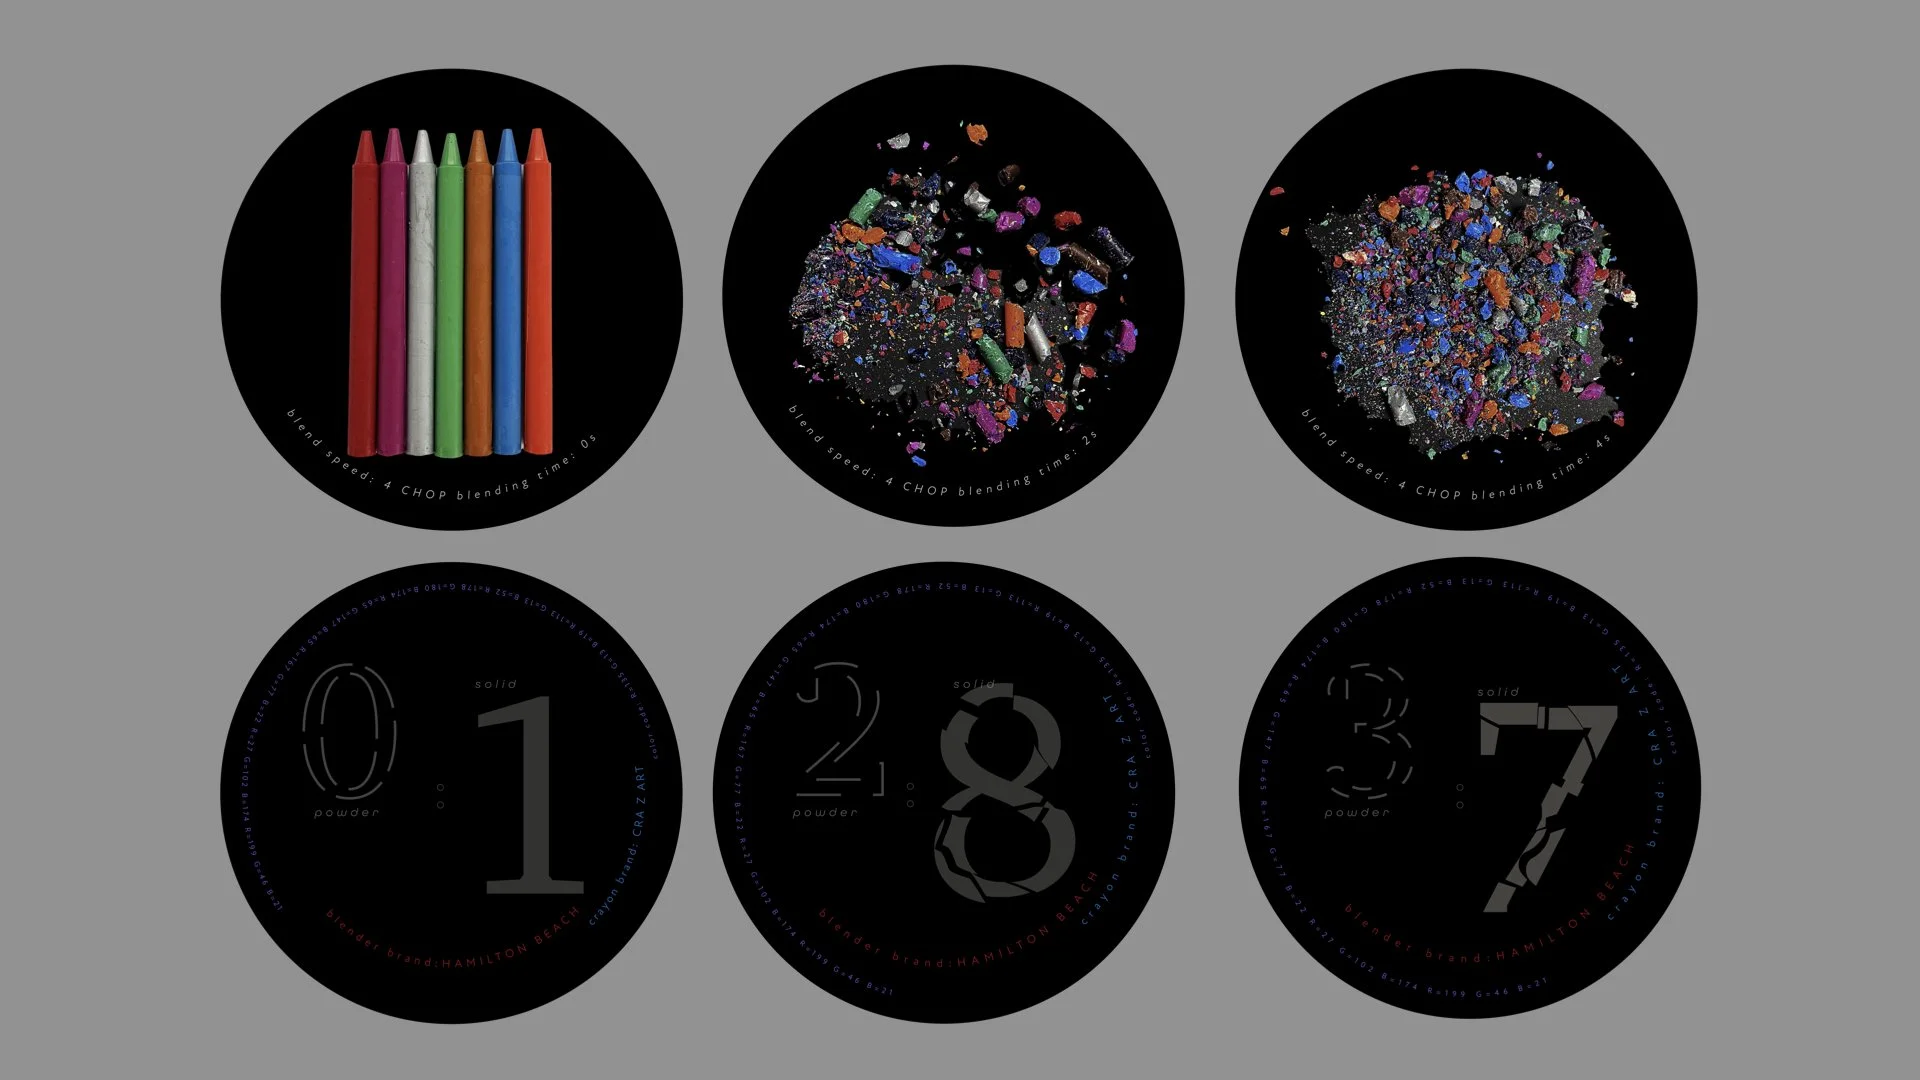
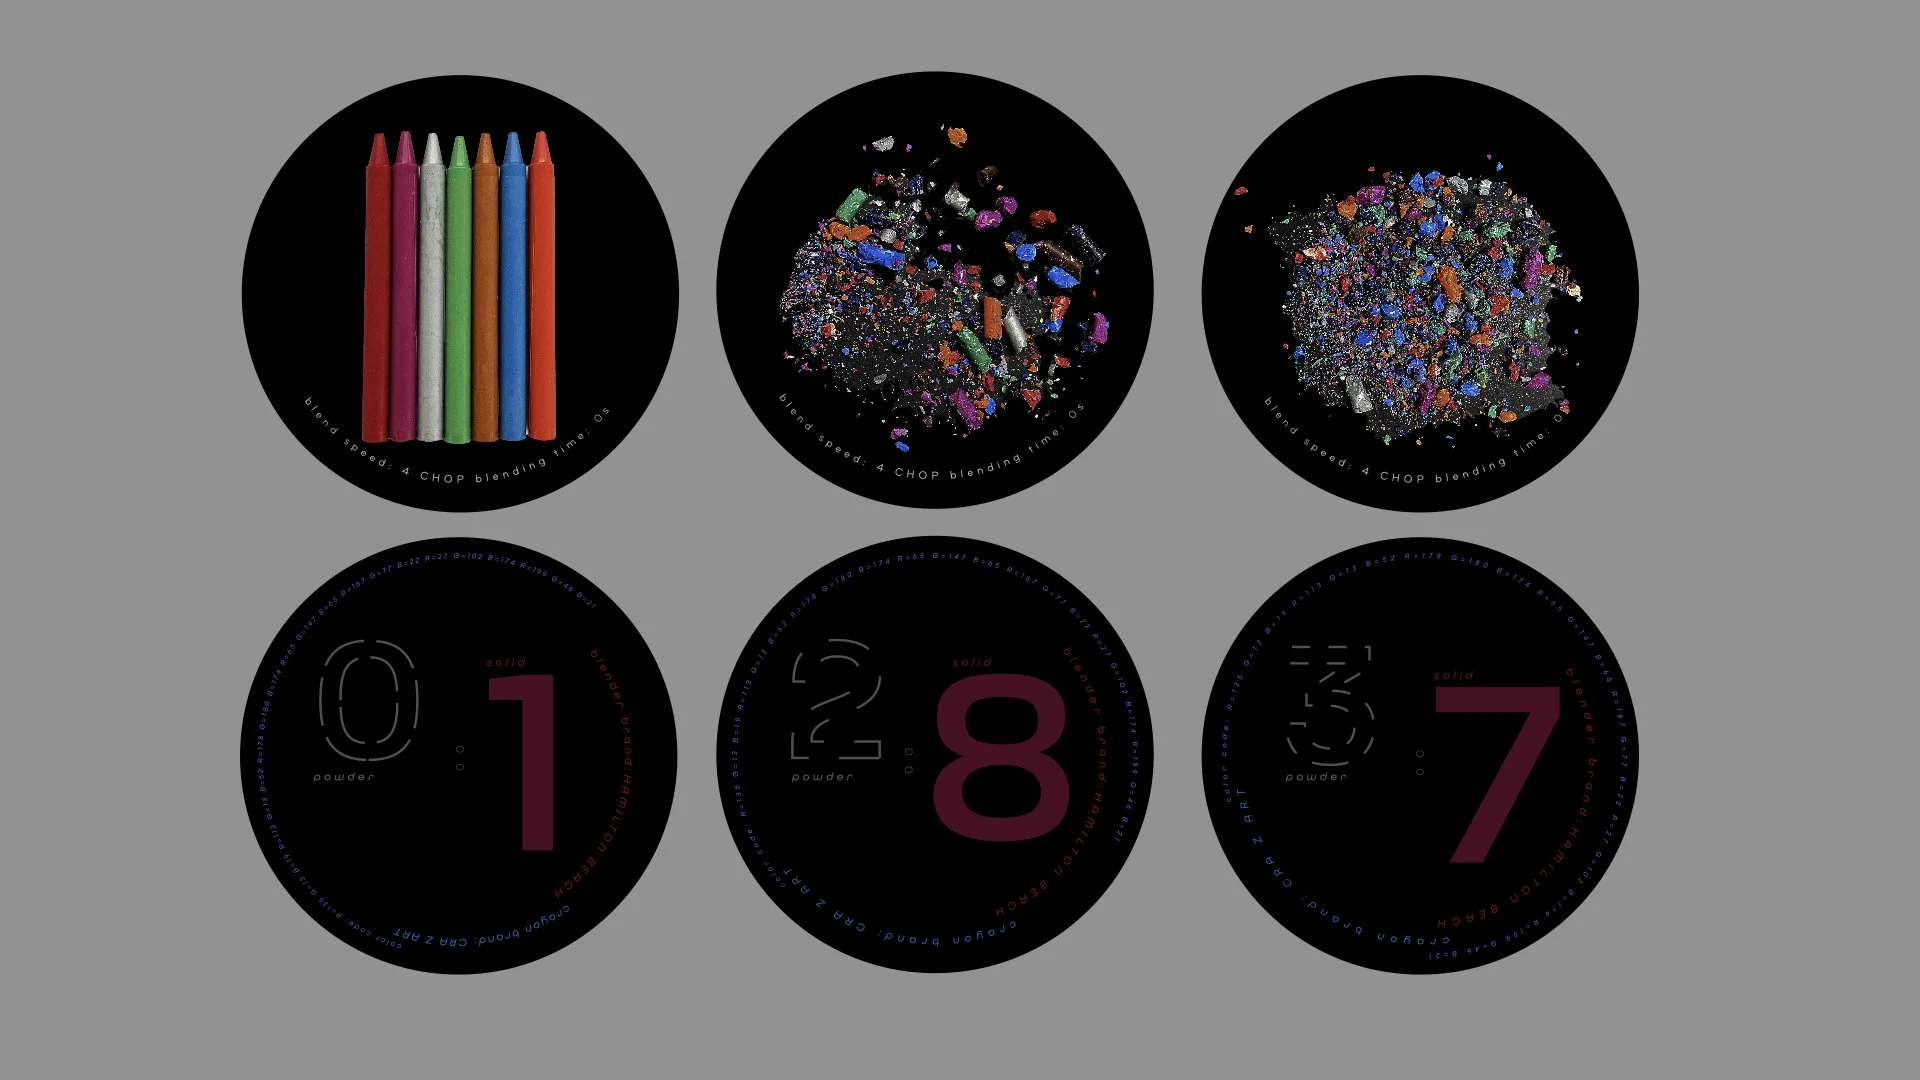
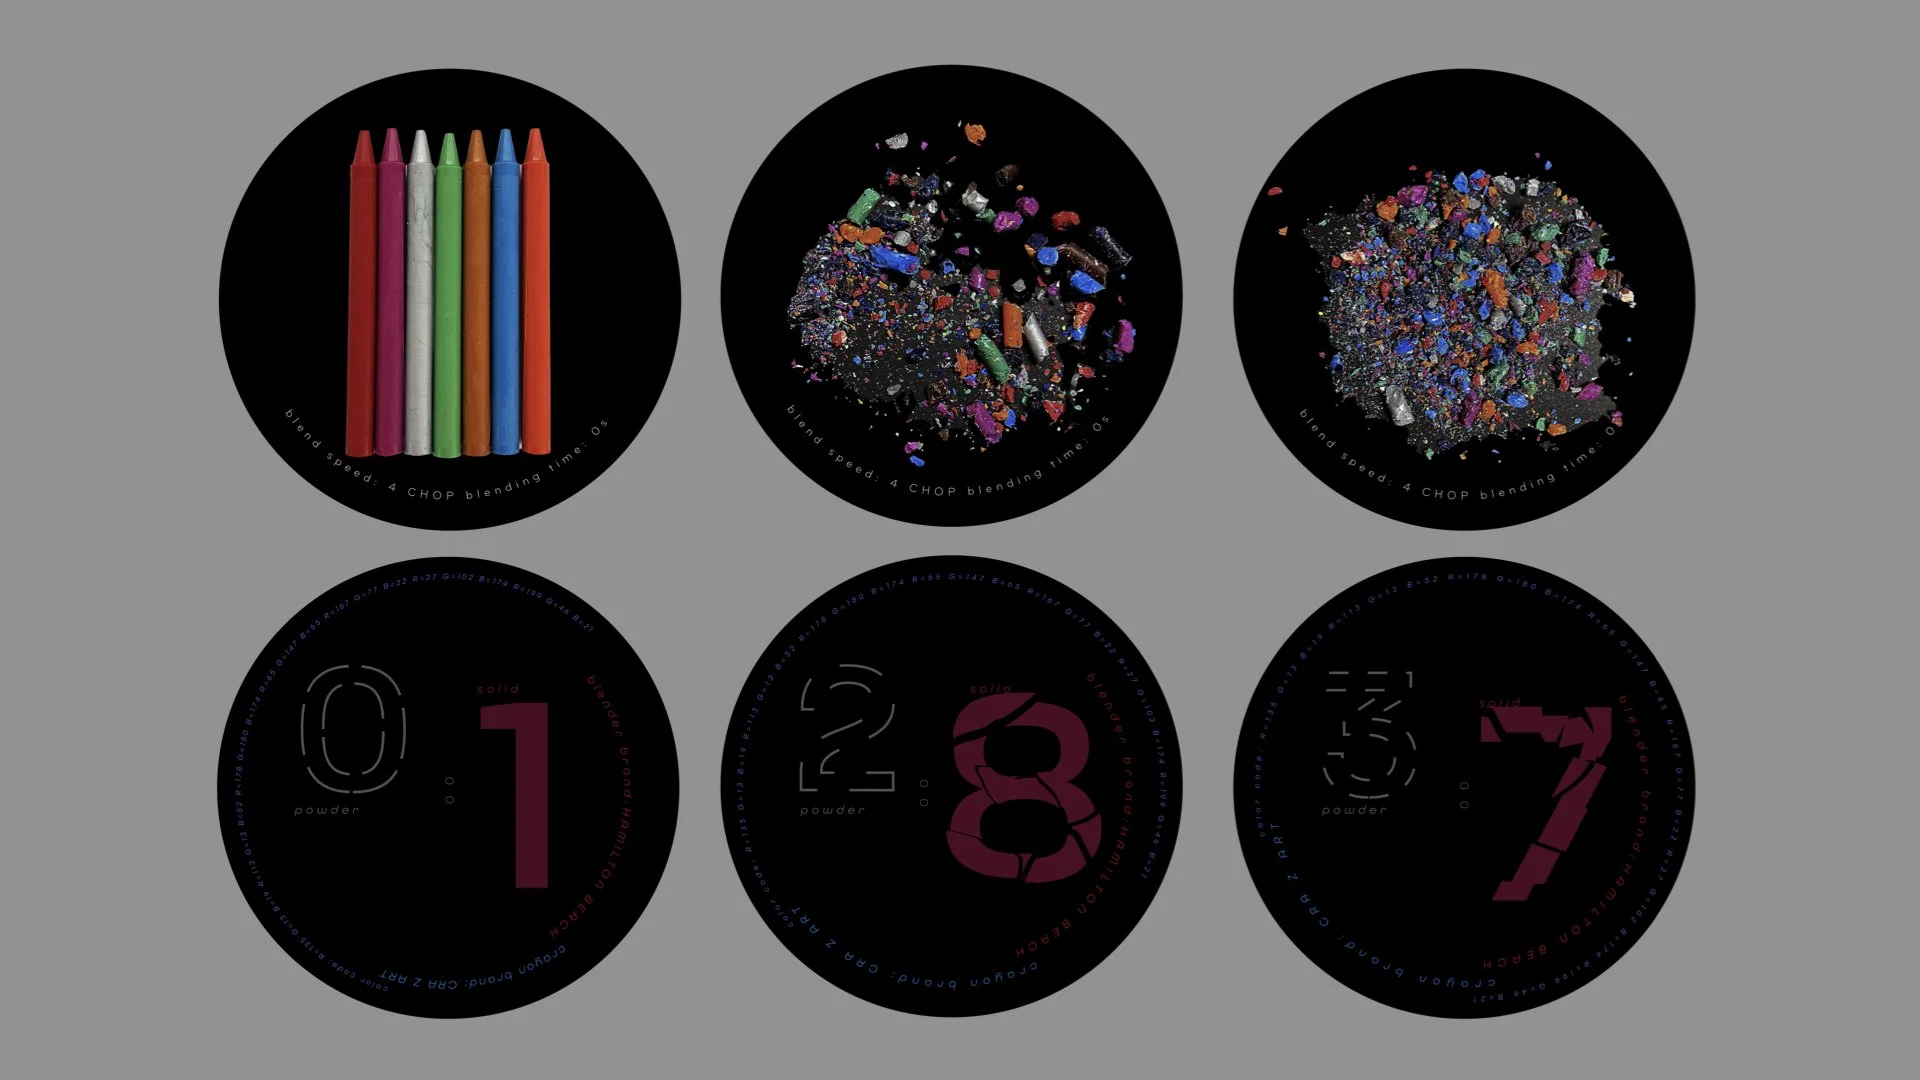
This project visualizes time through material transformation rather than conventional measurements such as minutes or seconds. I documented how colored crayons changed from organized solid forms into fragmented matter through repeated blending, collecting approximately 200 data points across different stages of the process.
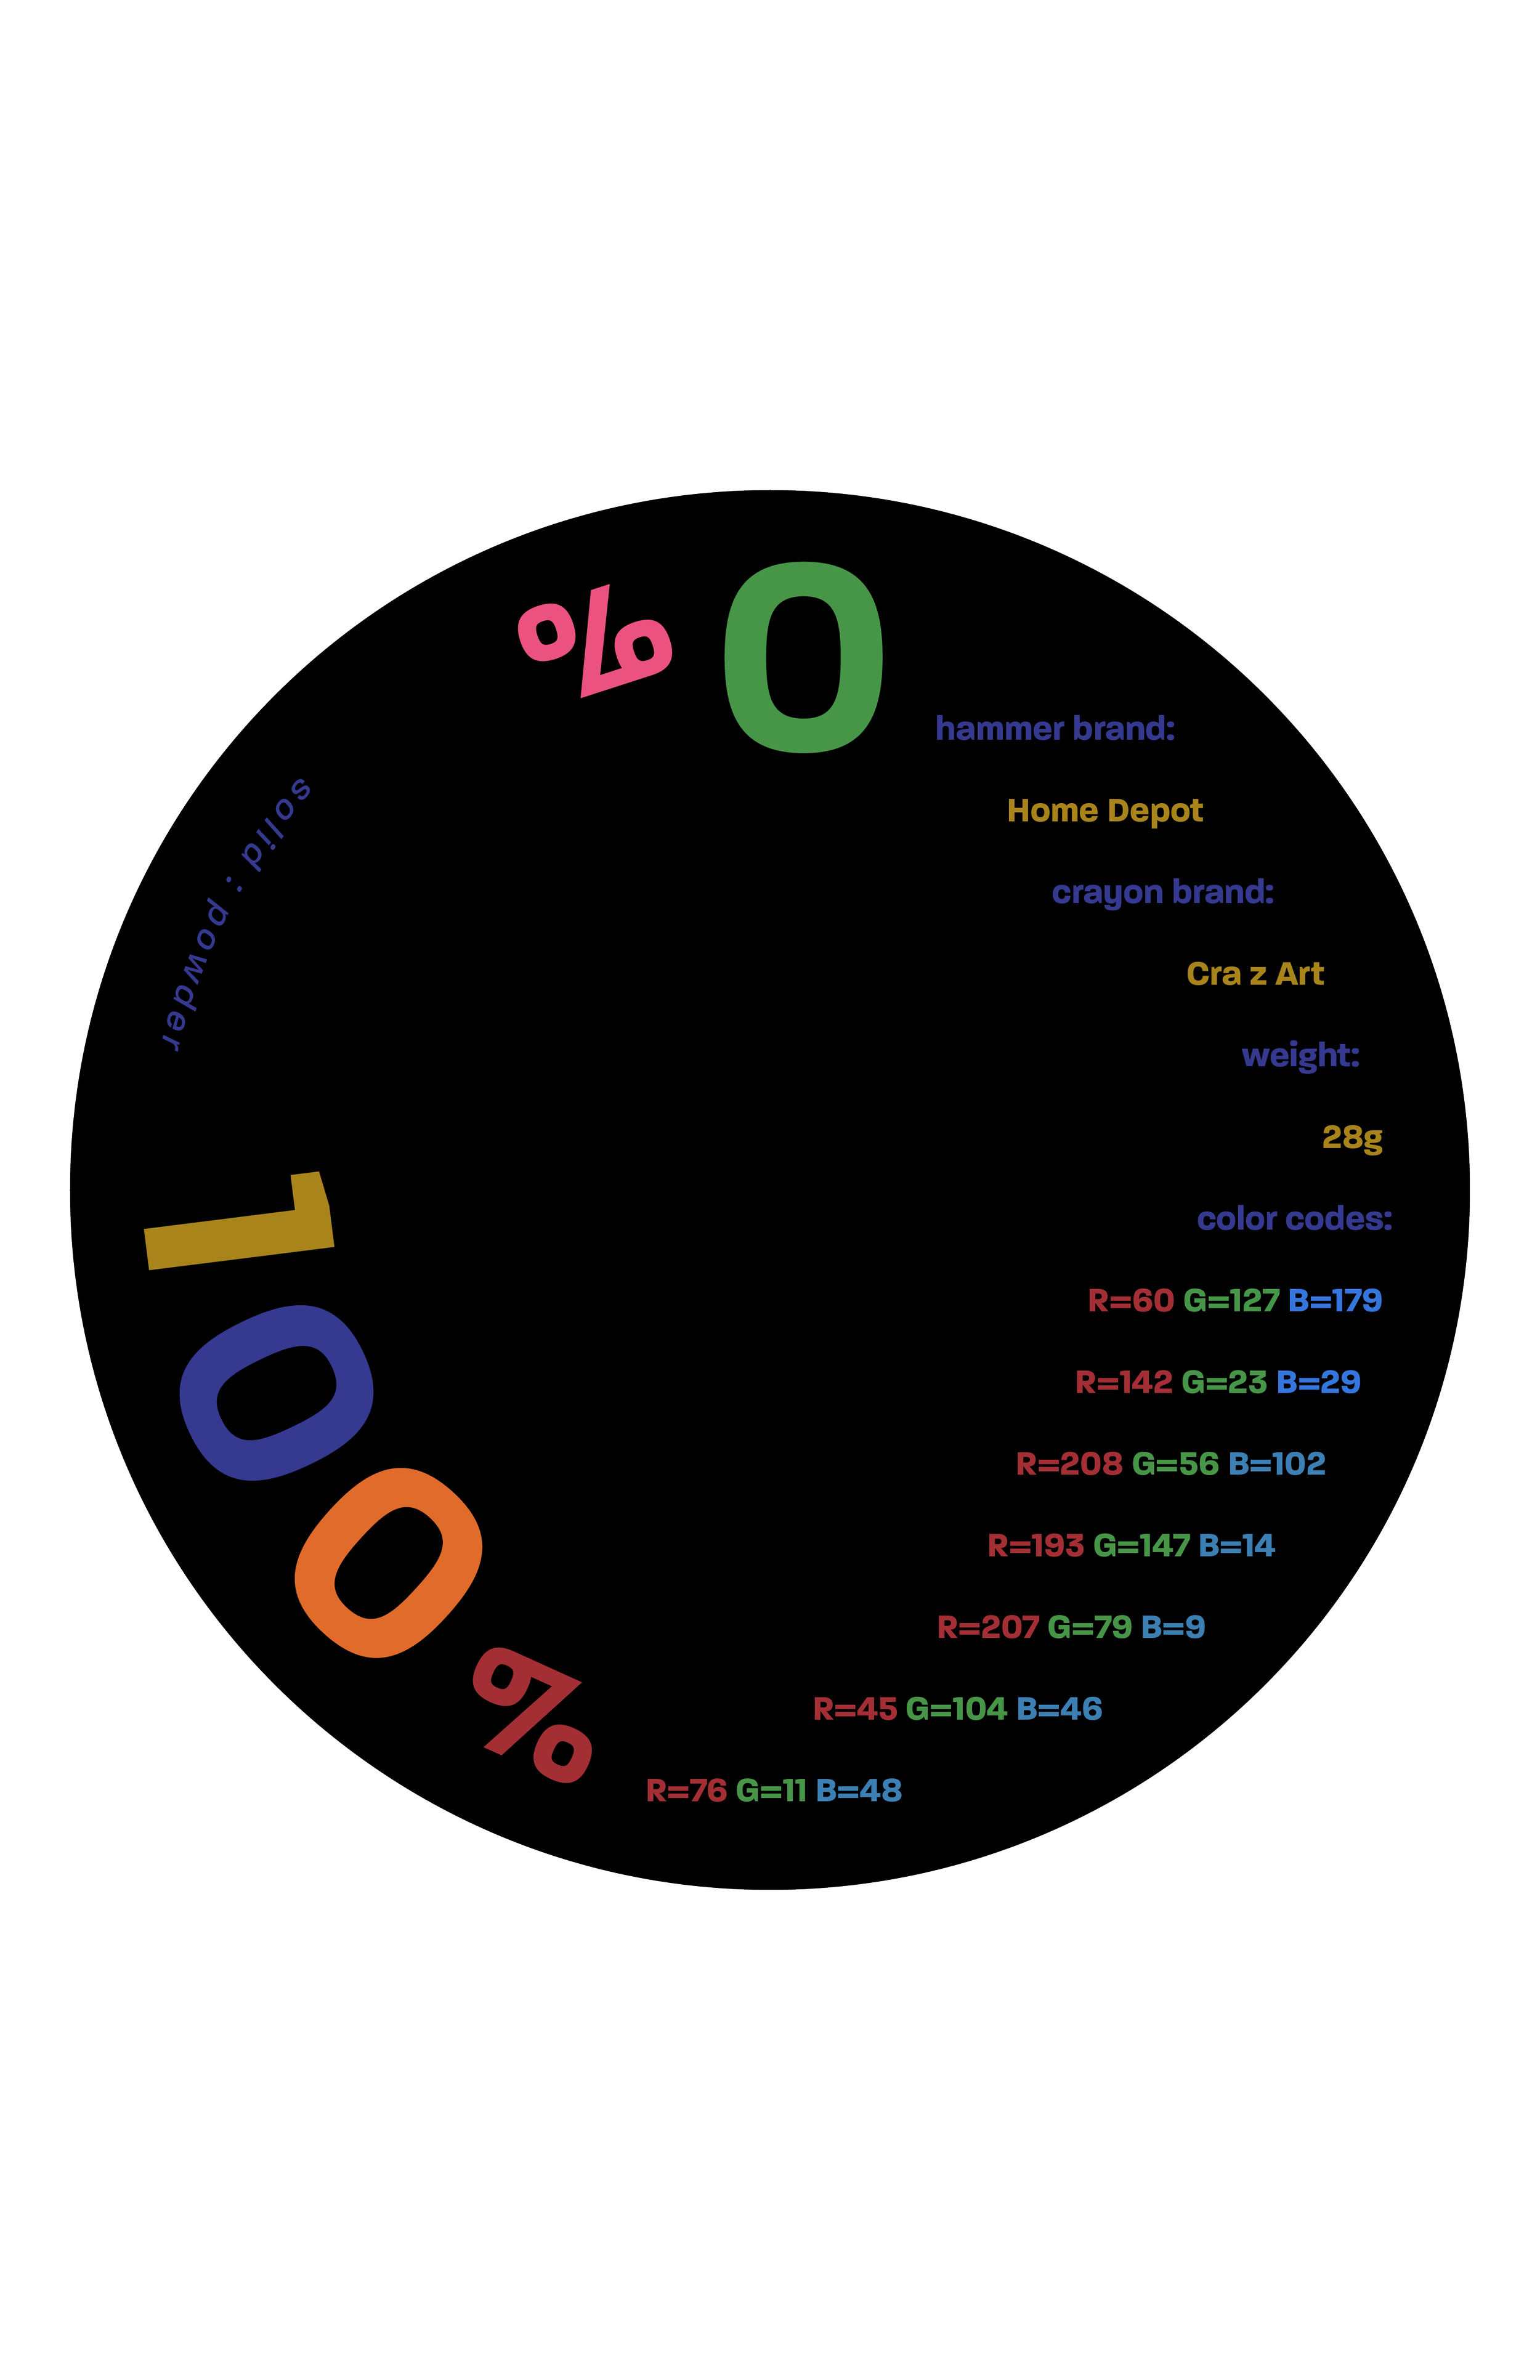
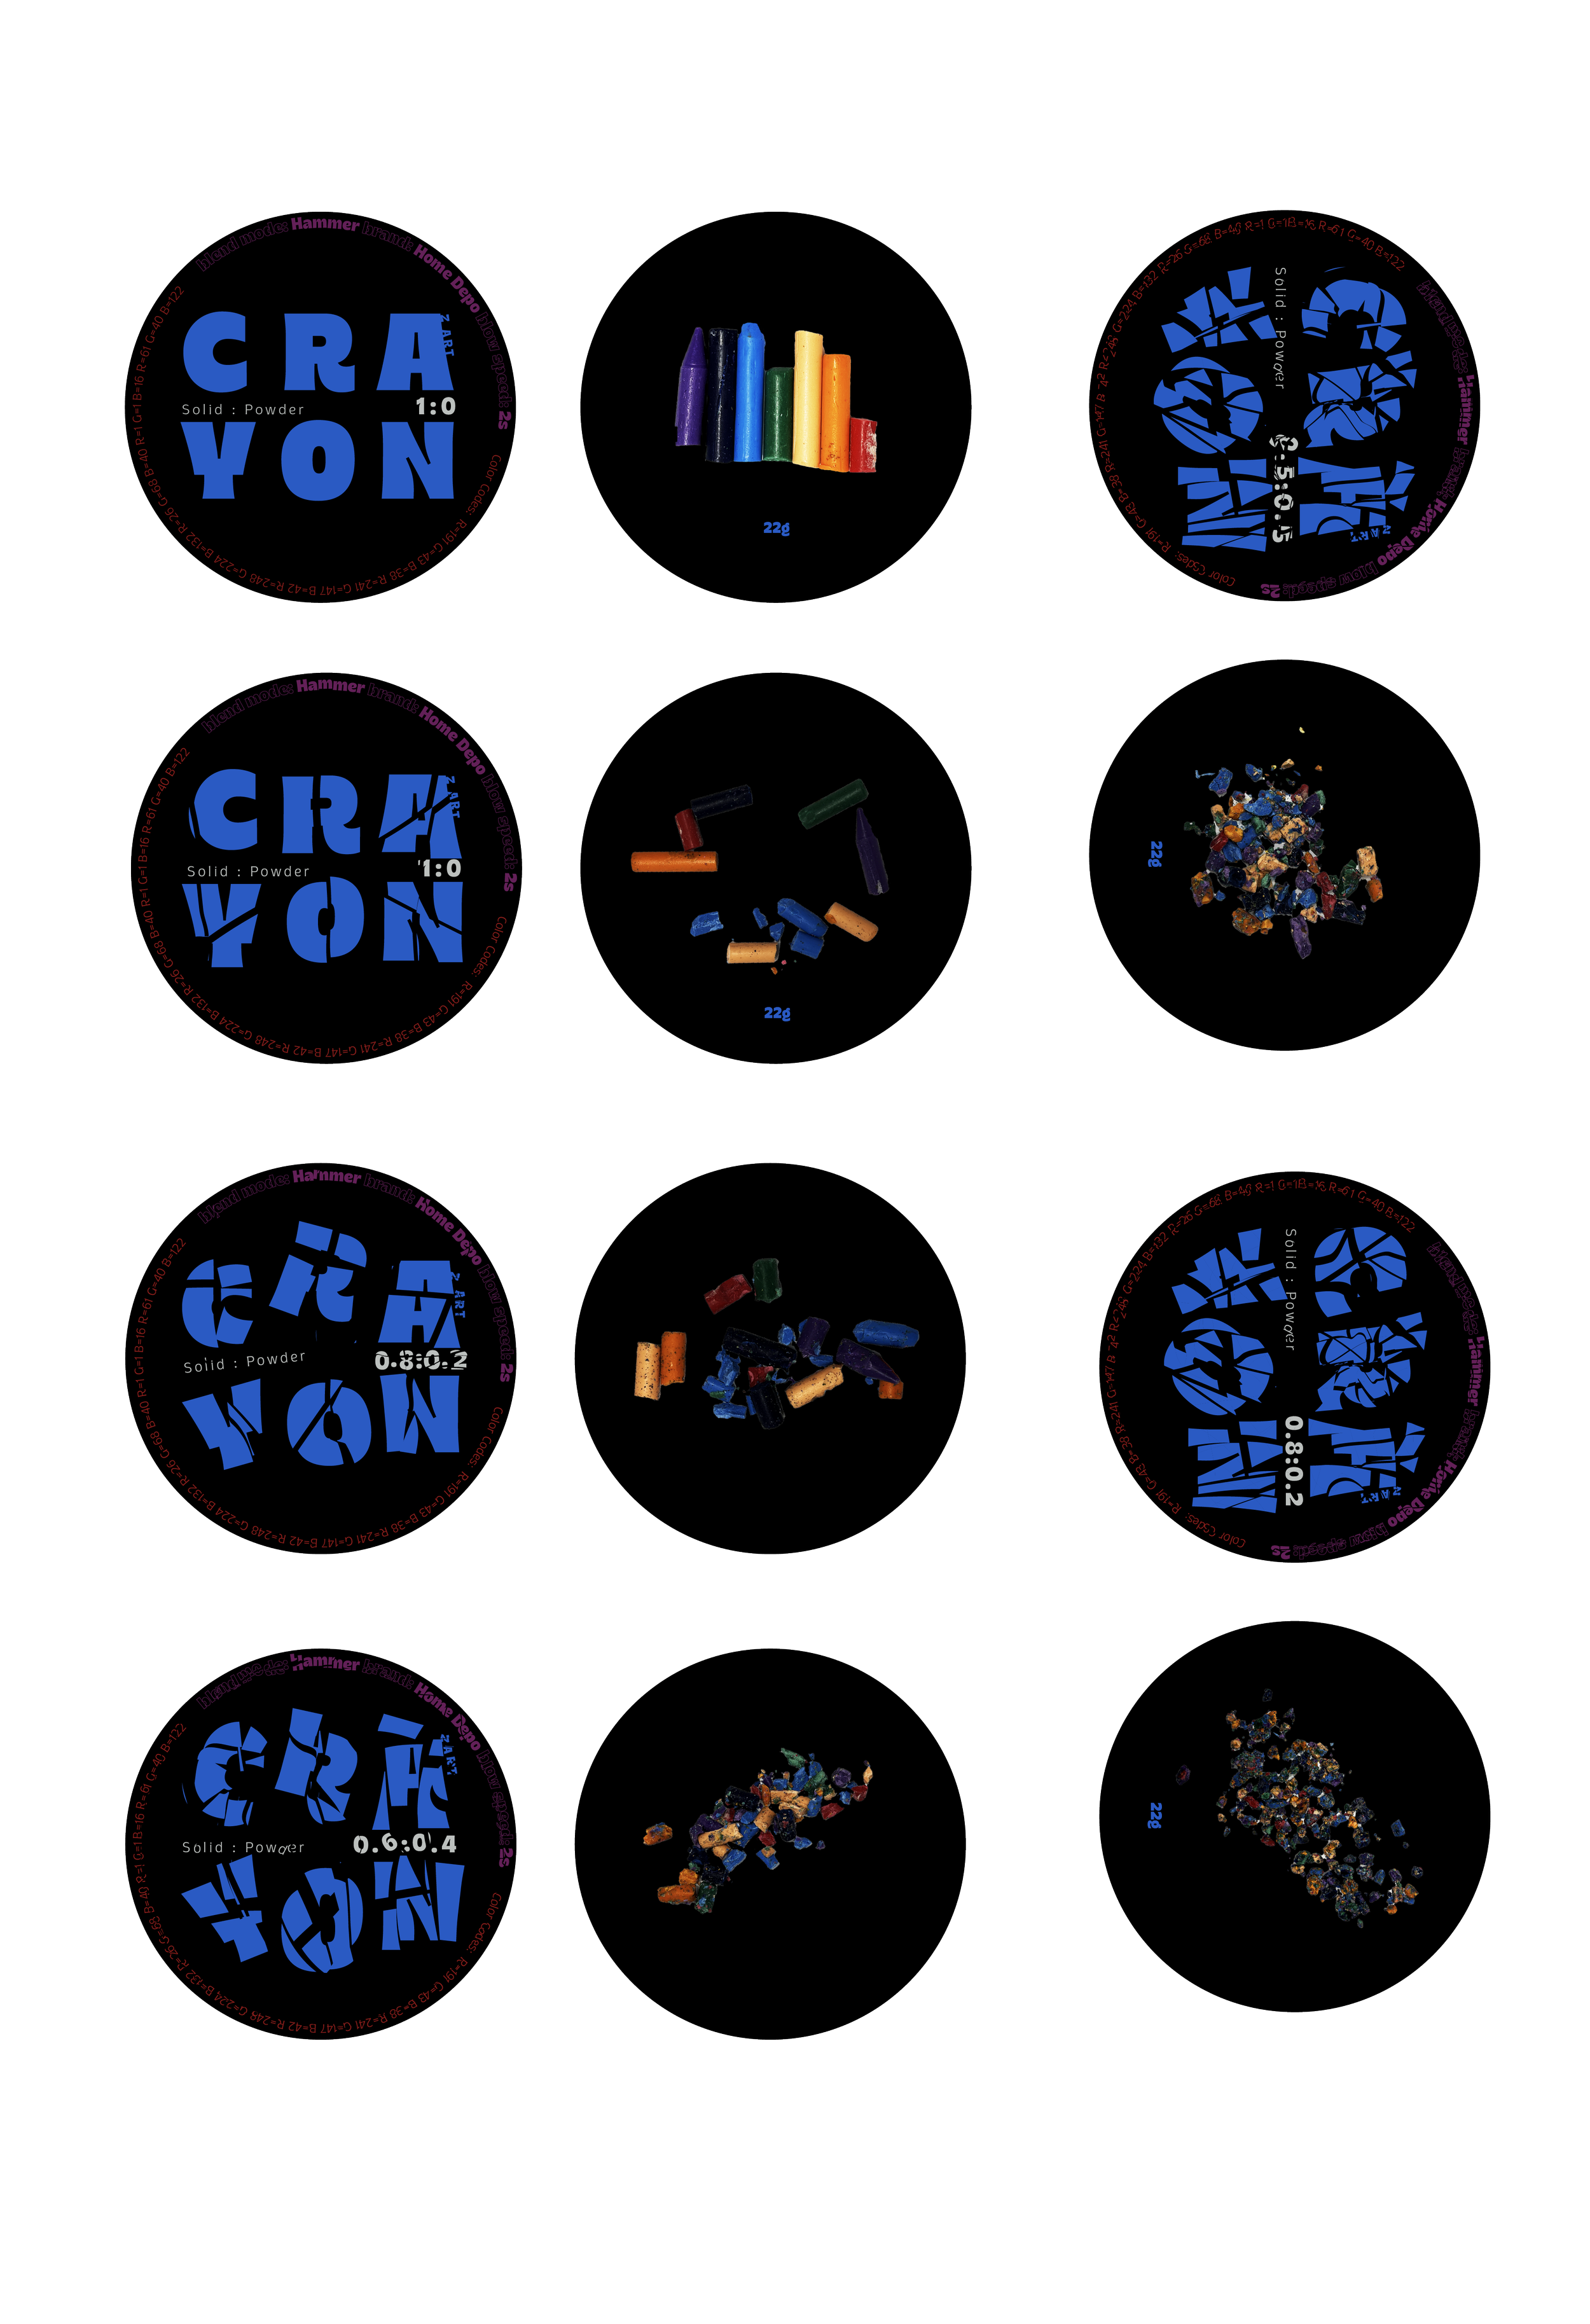
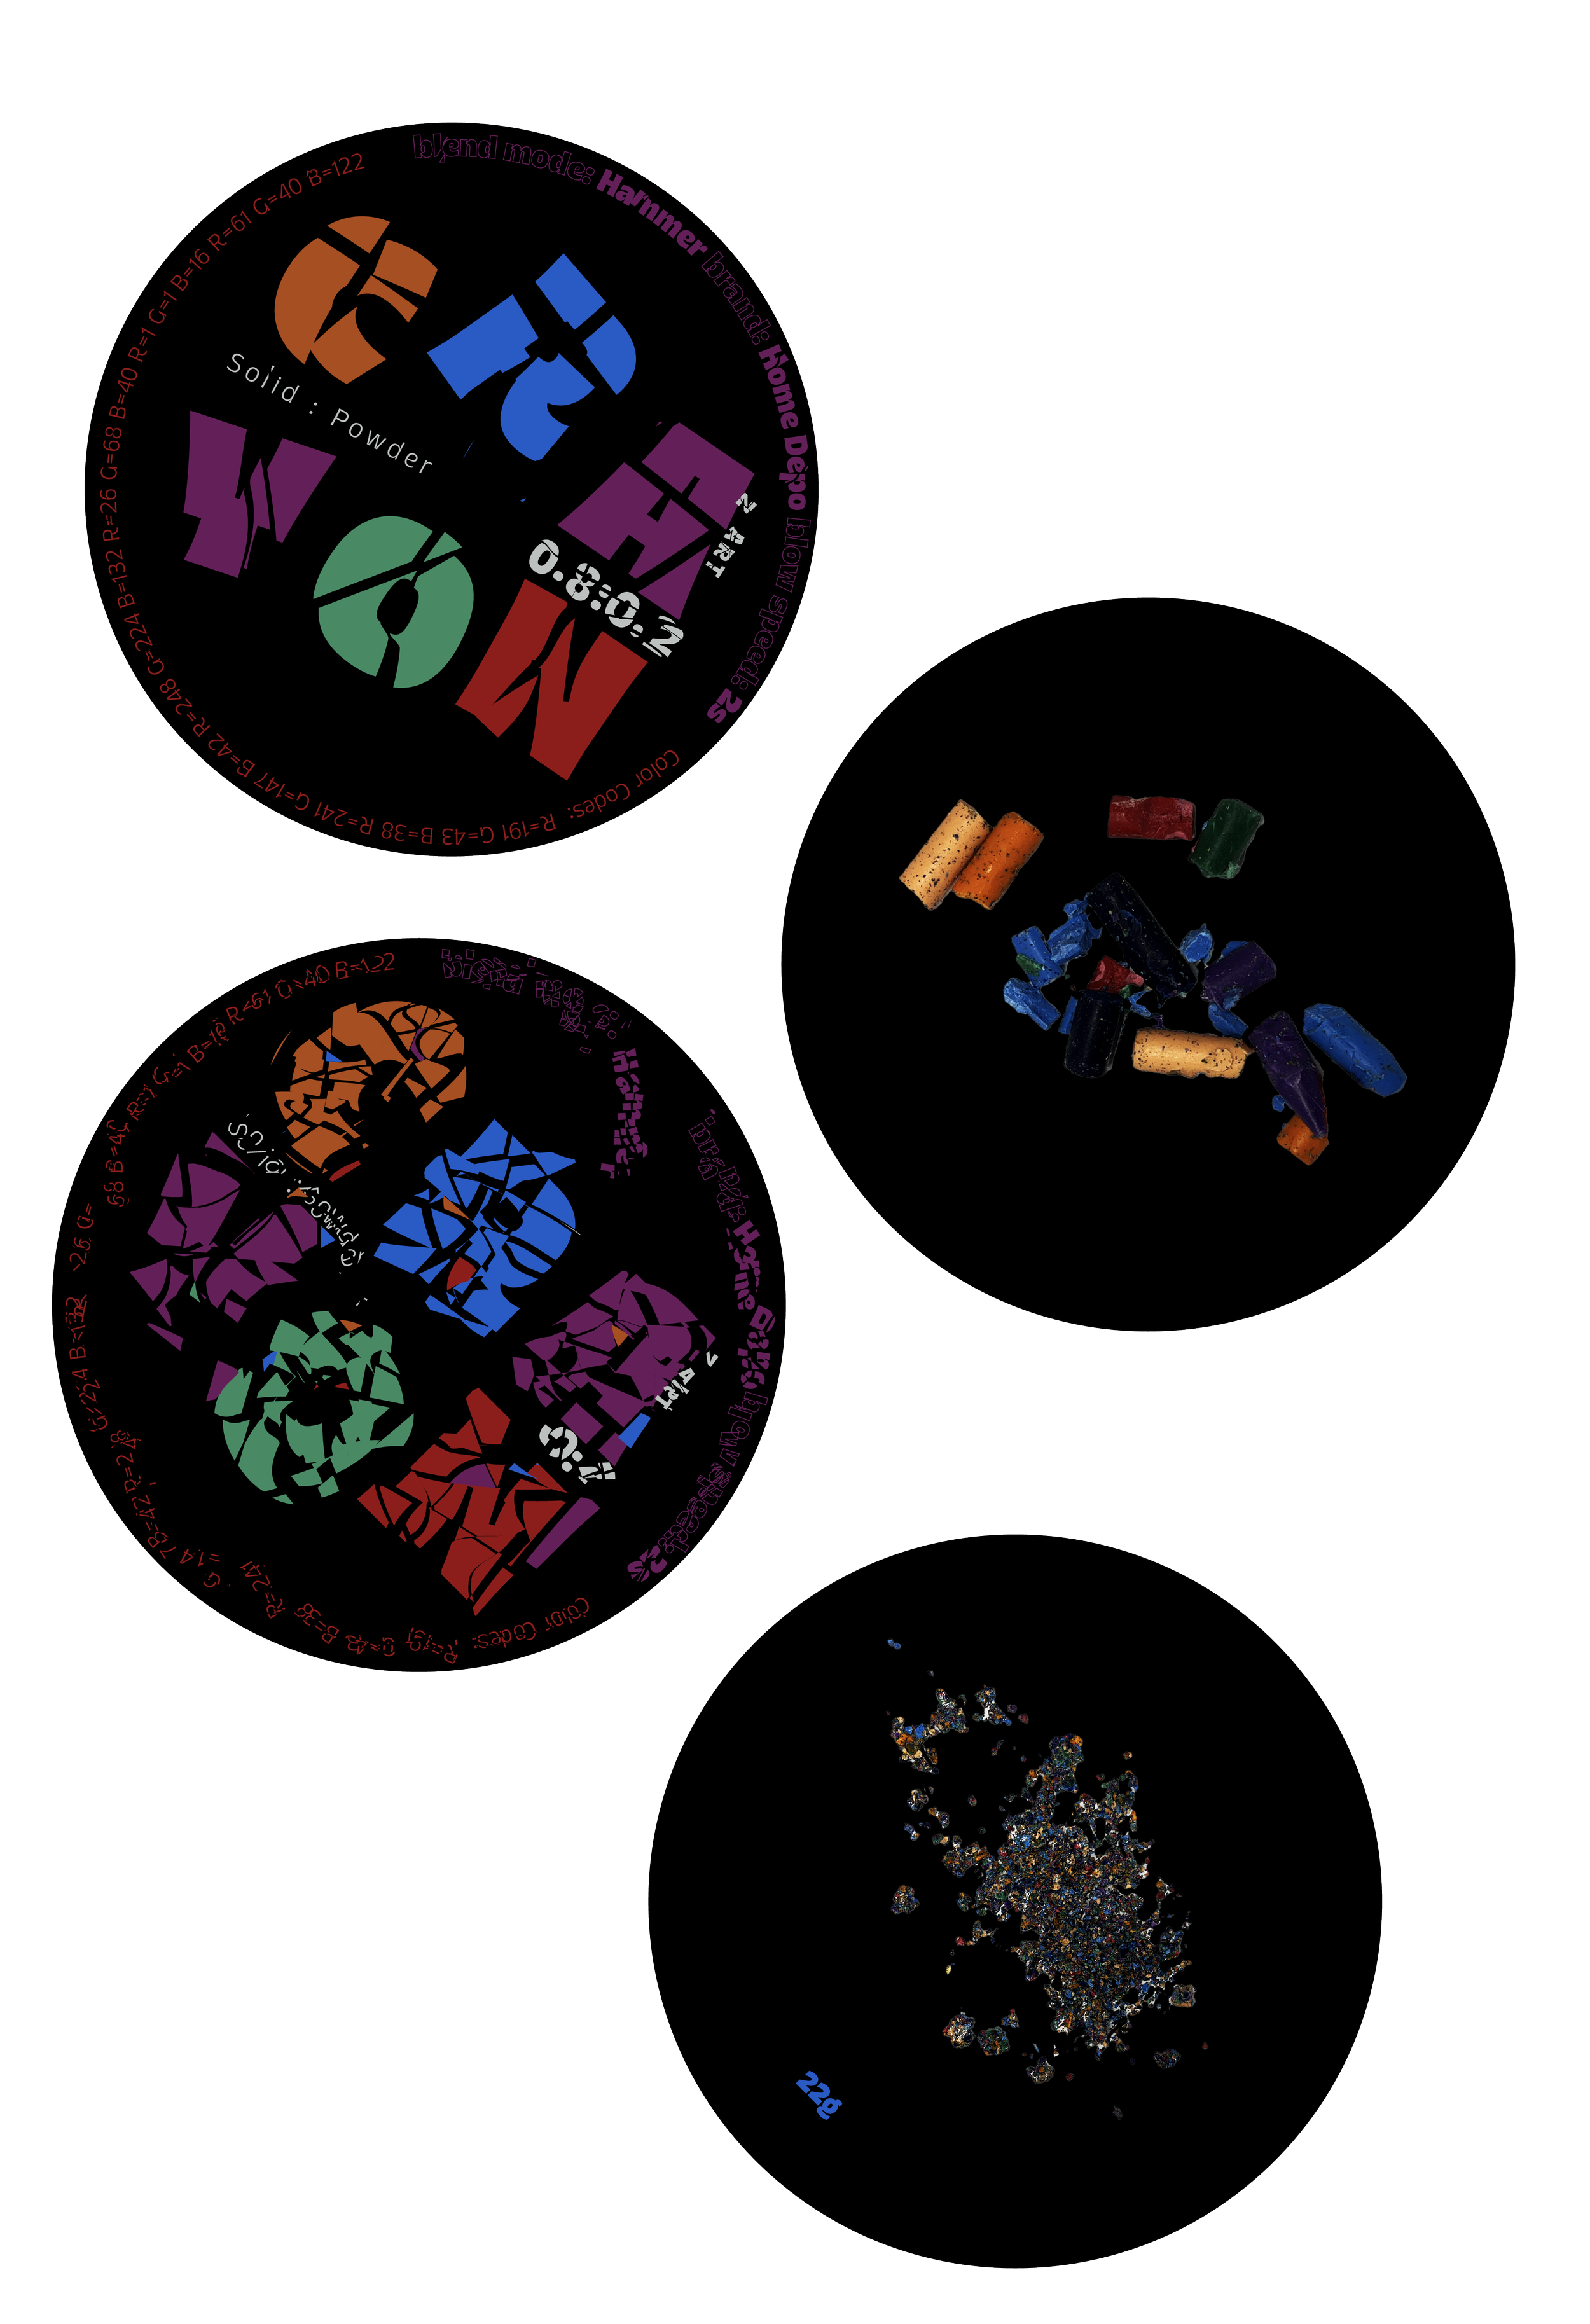
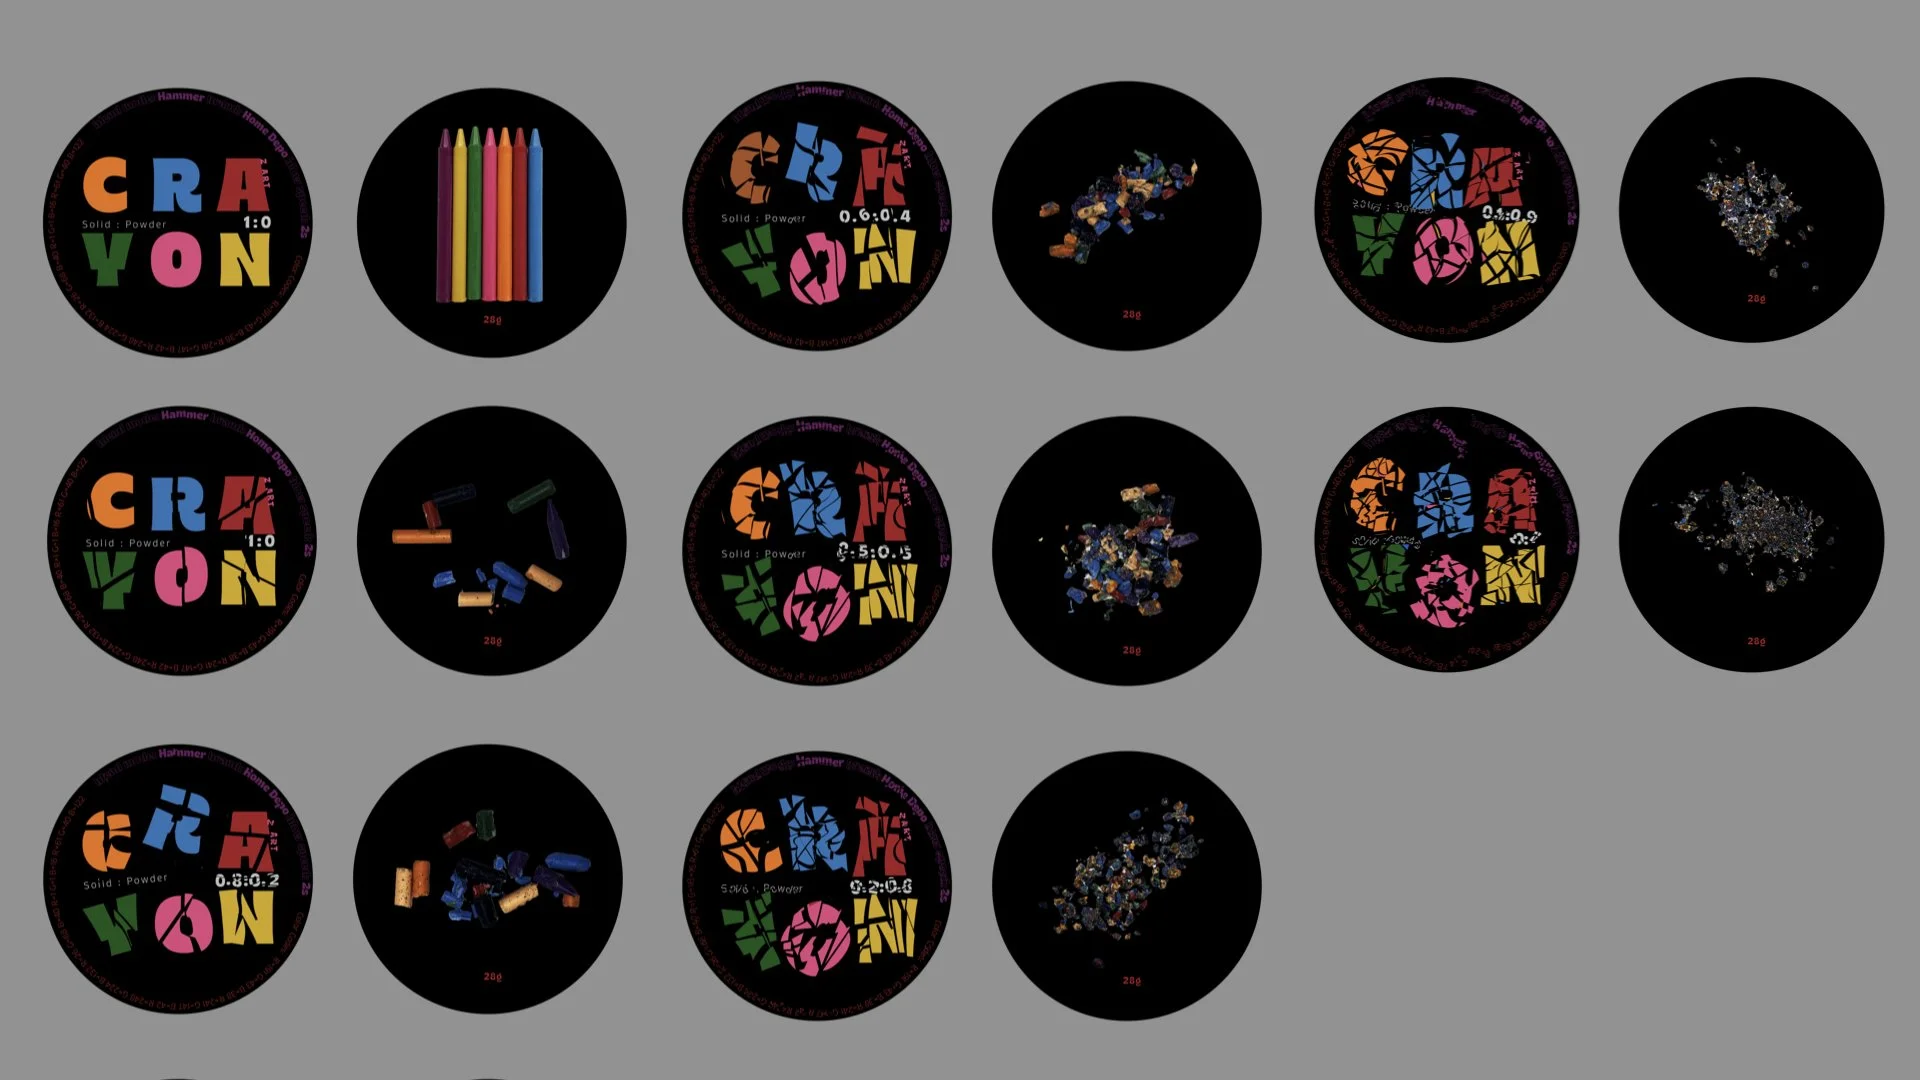
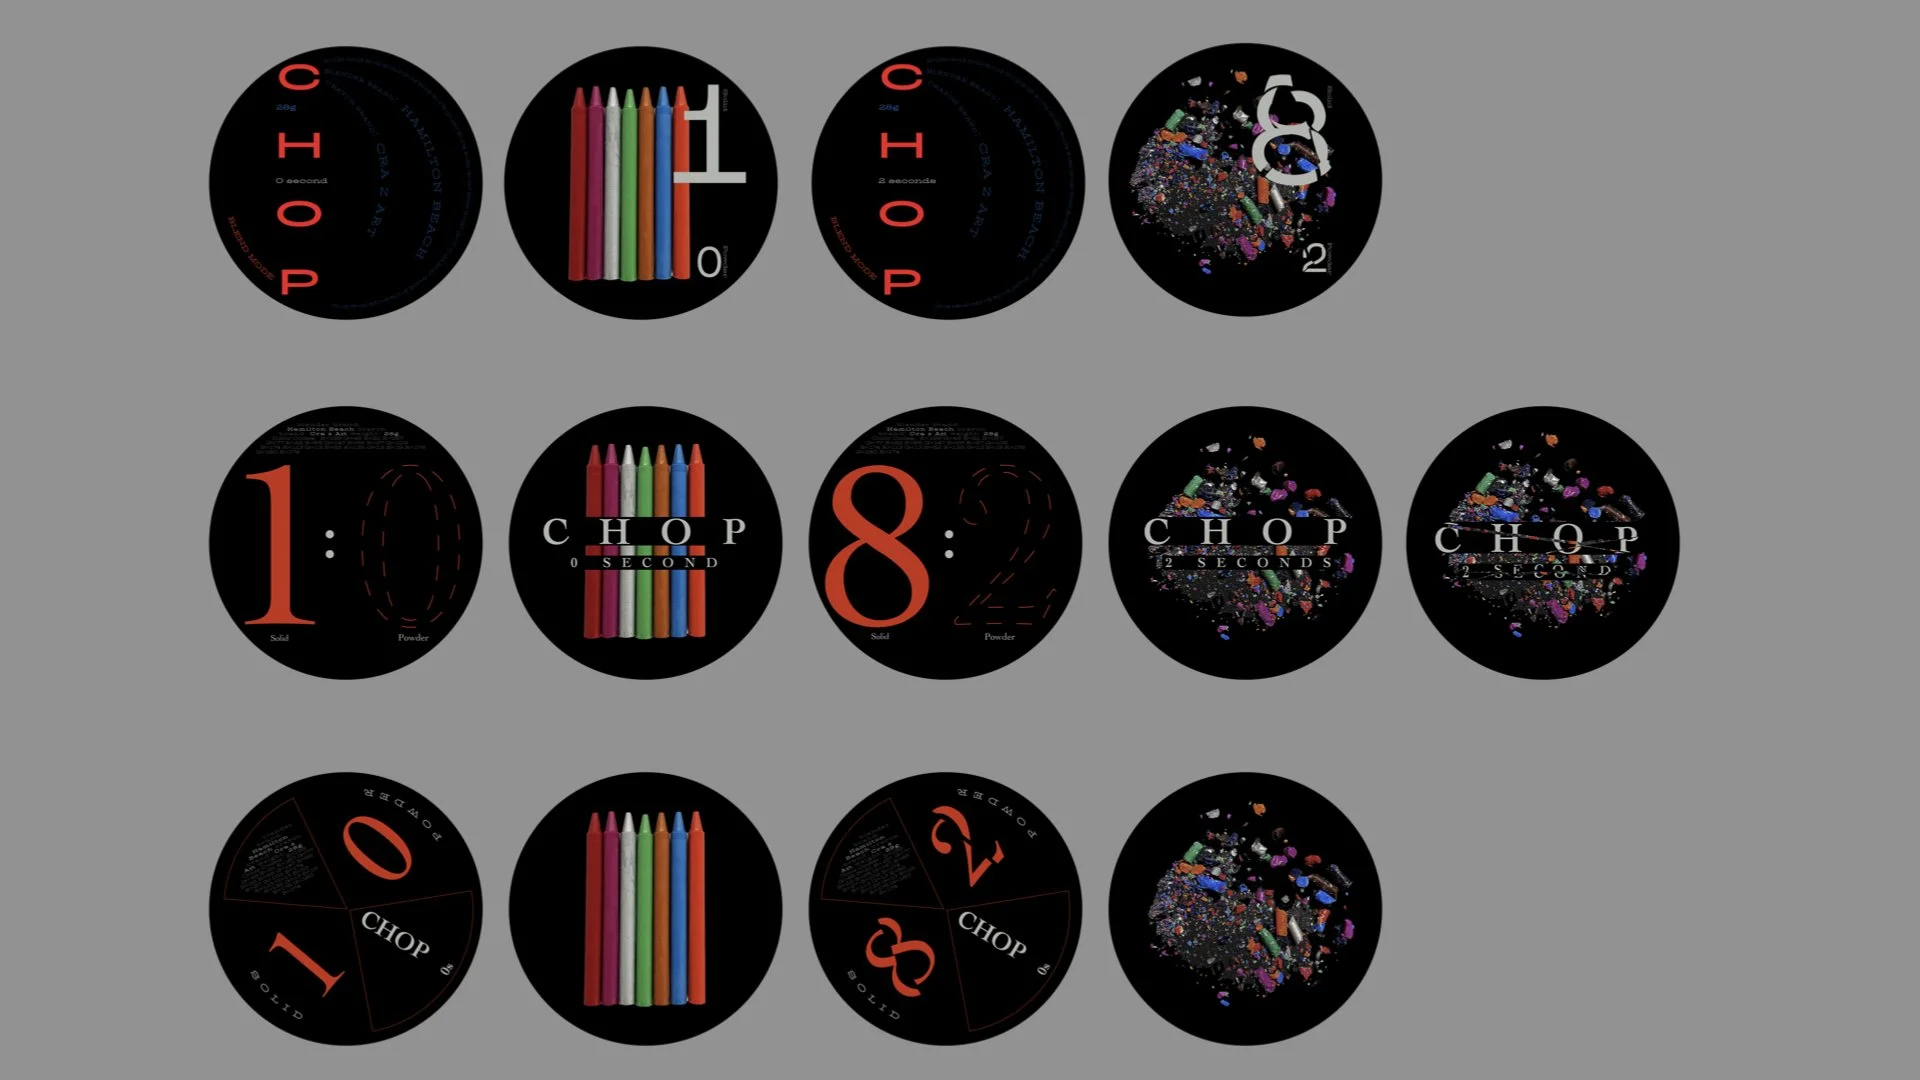
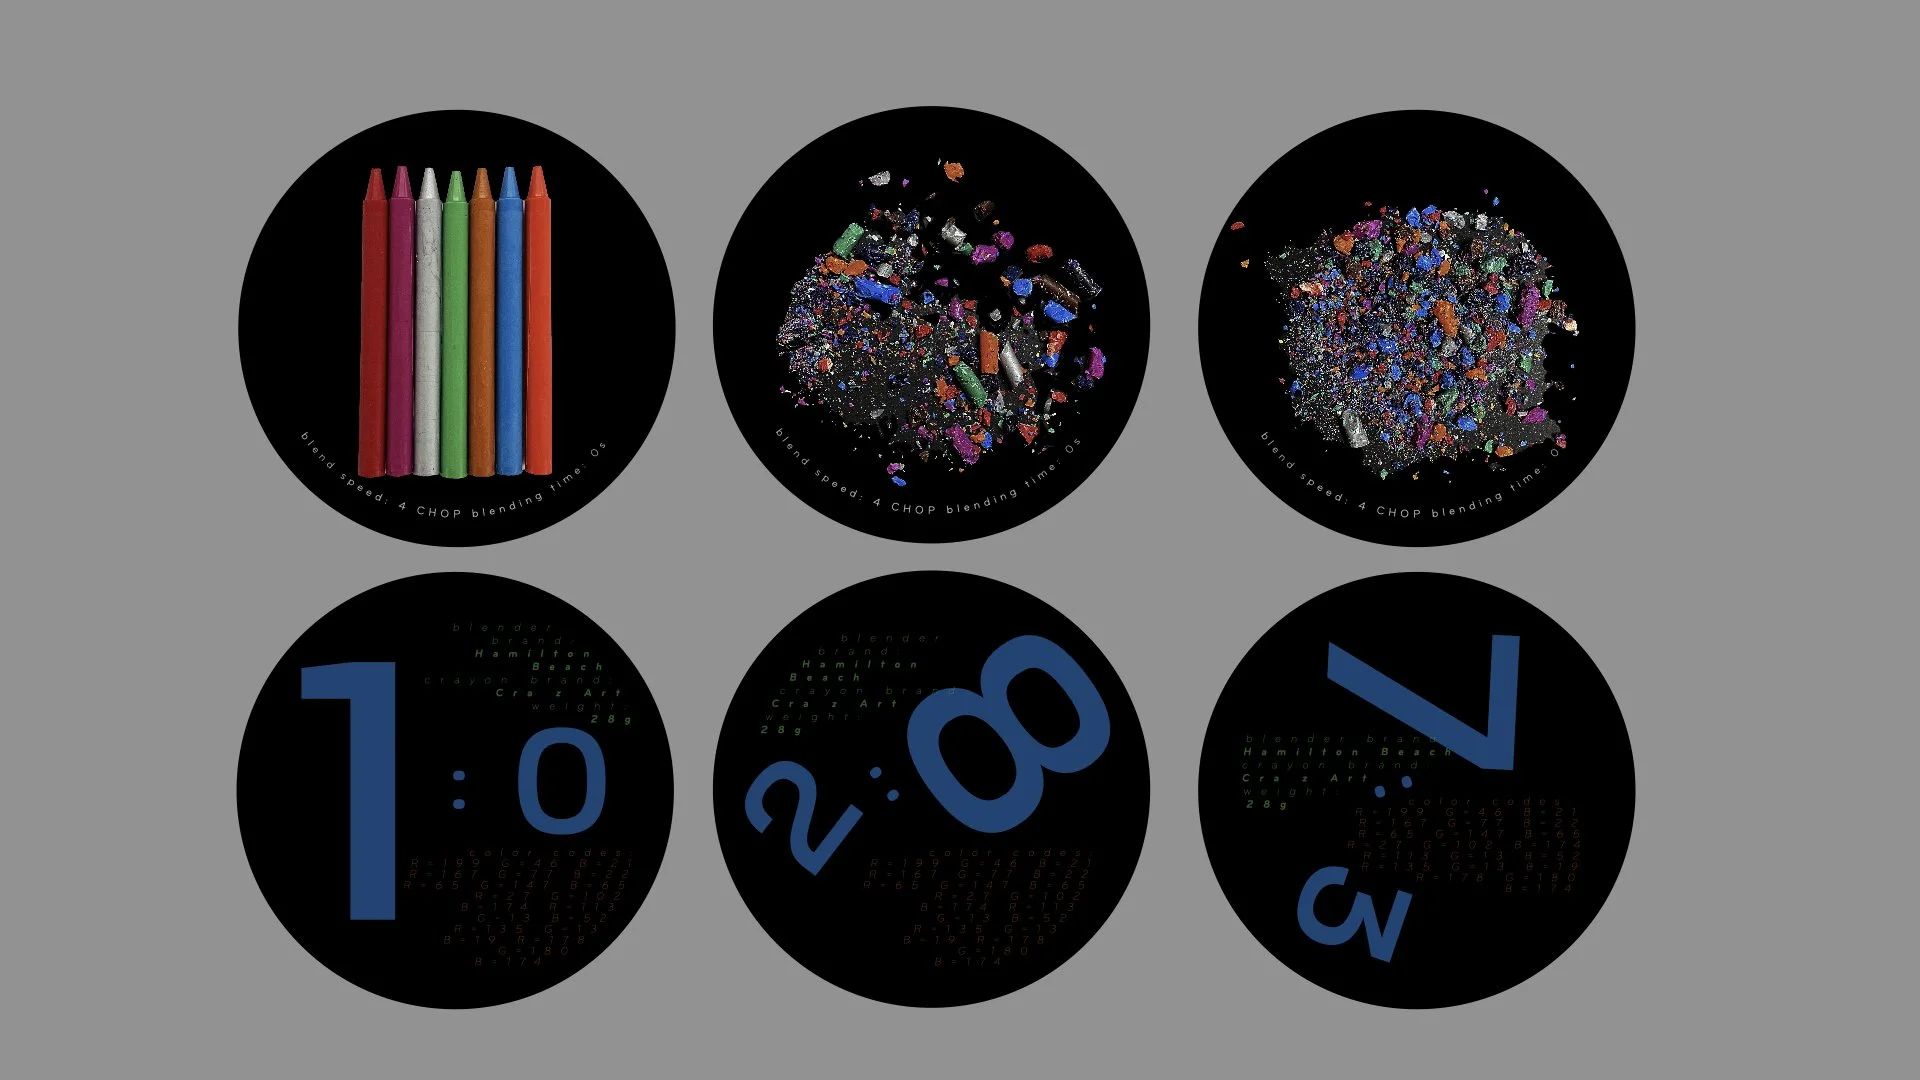
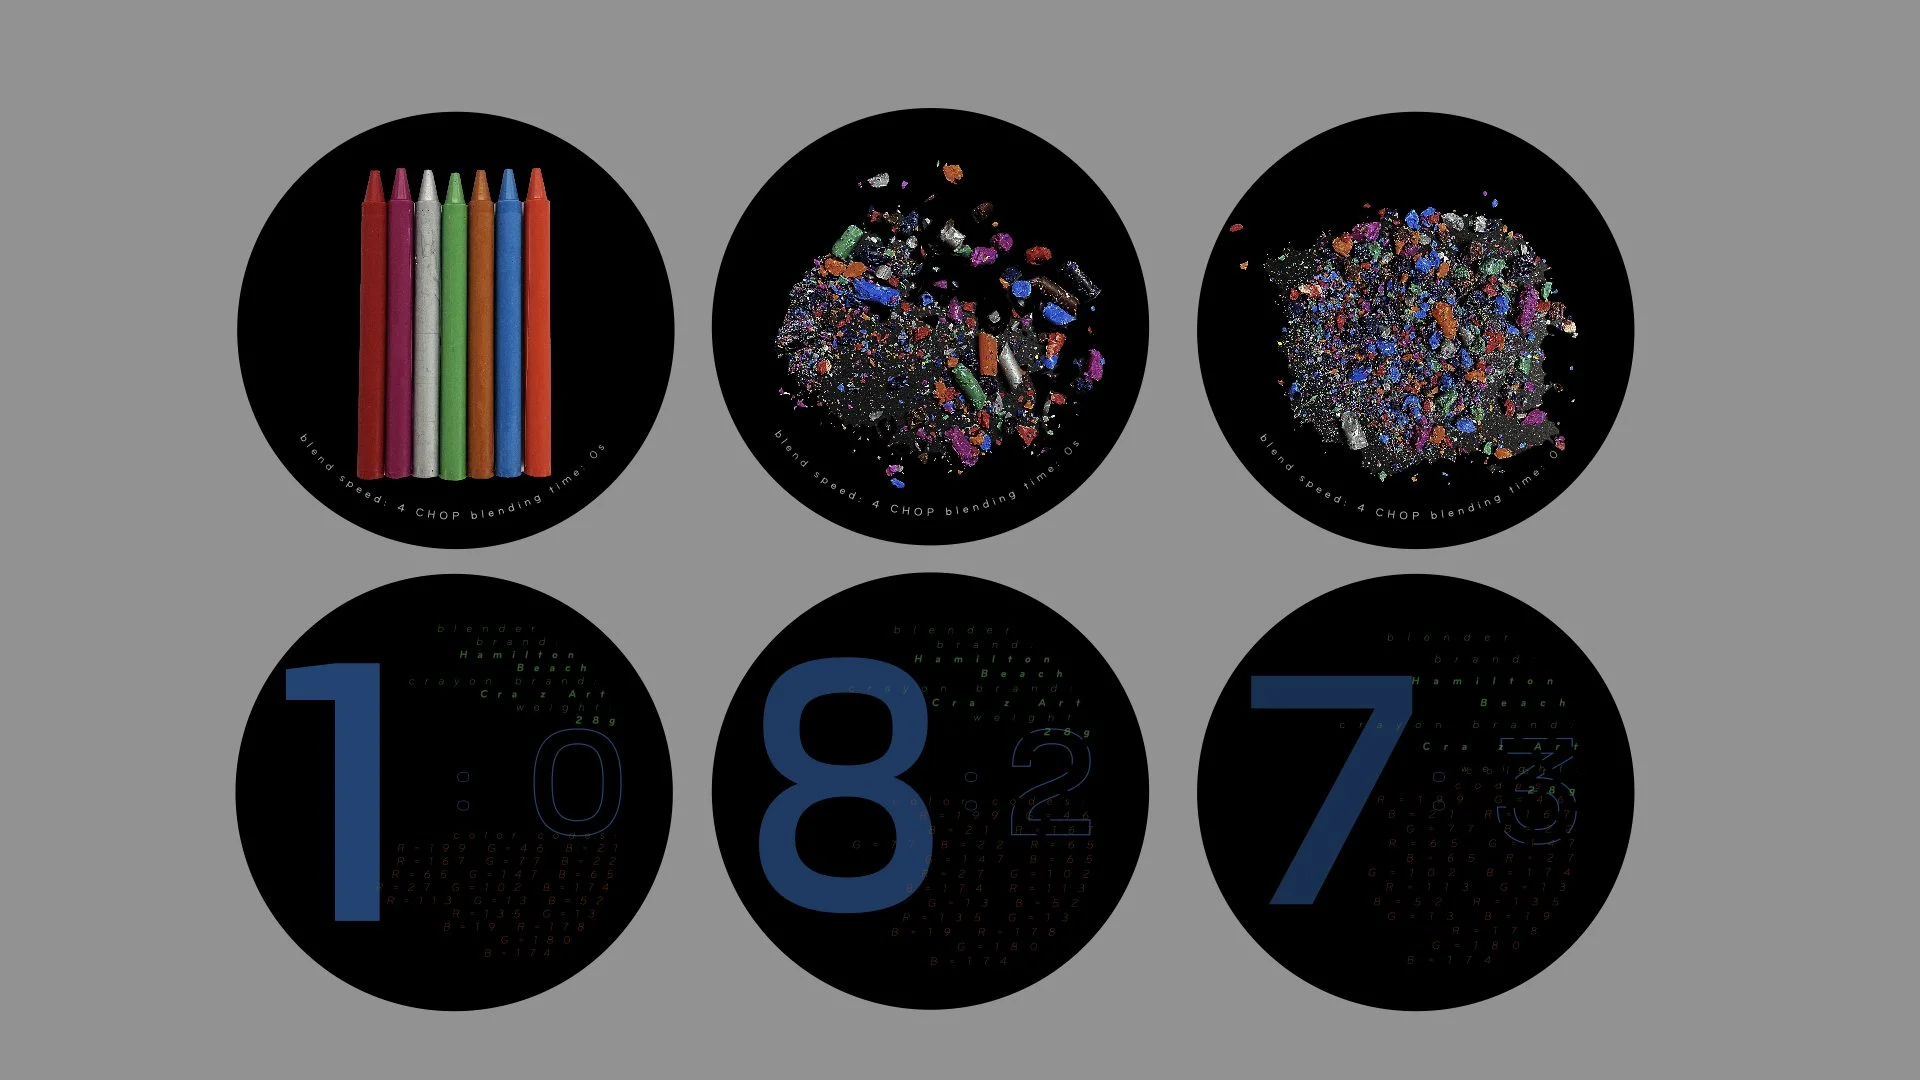
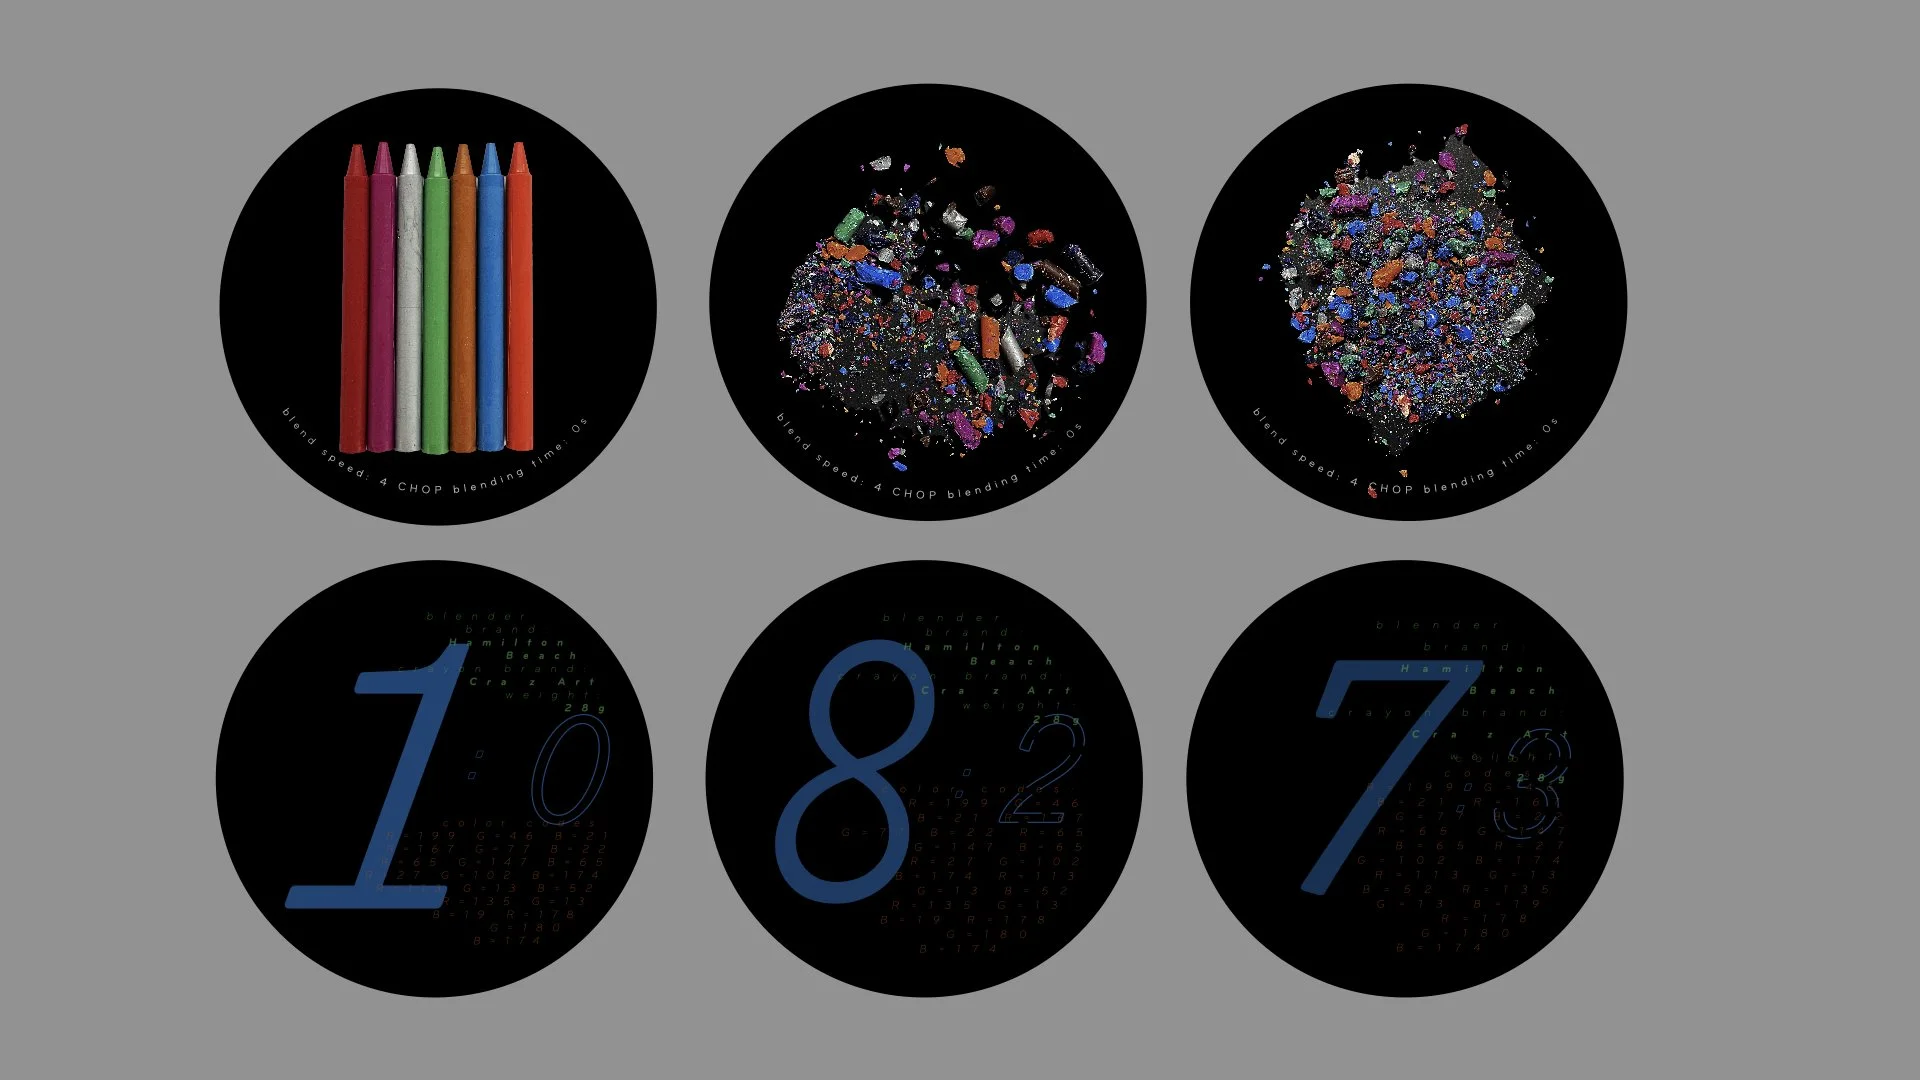
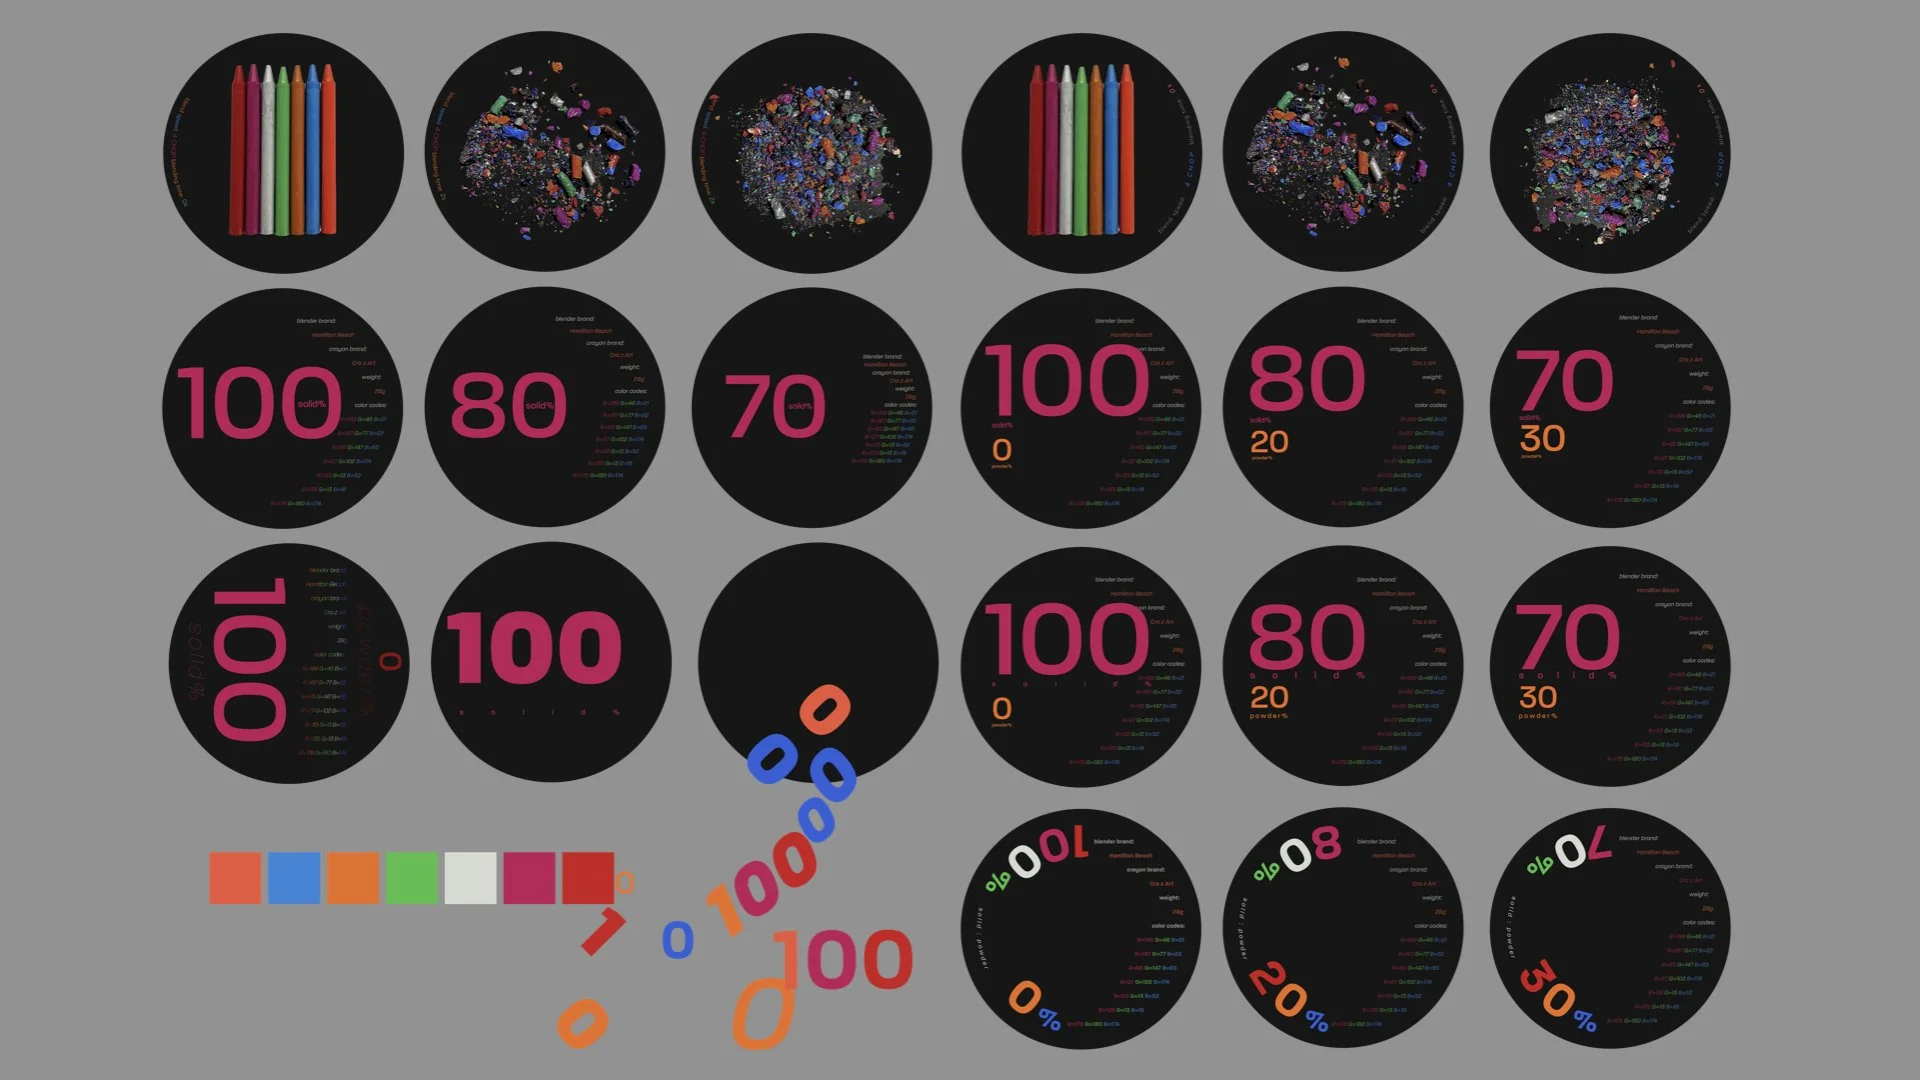
After testing multiple visualization strategies, I established a clearer system in the third iteration to map the gradual transition from order to chaos. The data was then translated into a circular publication that I printed, constructed, and assembled by hand.
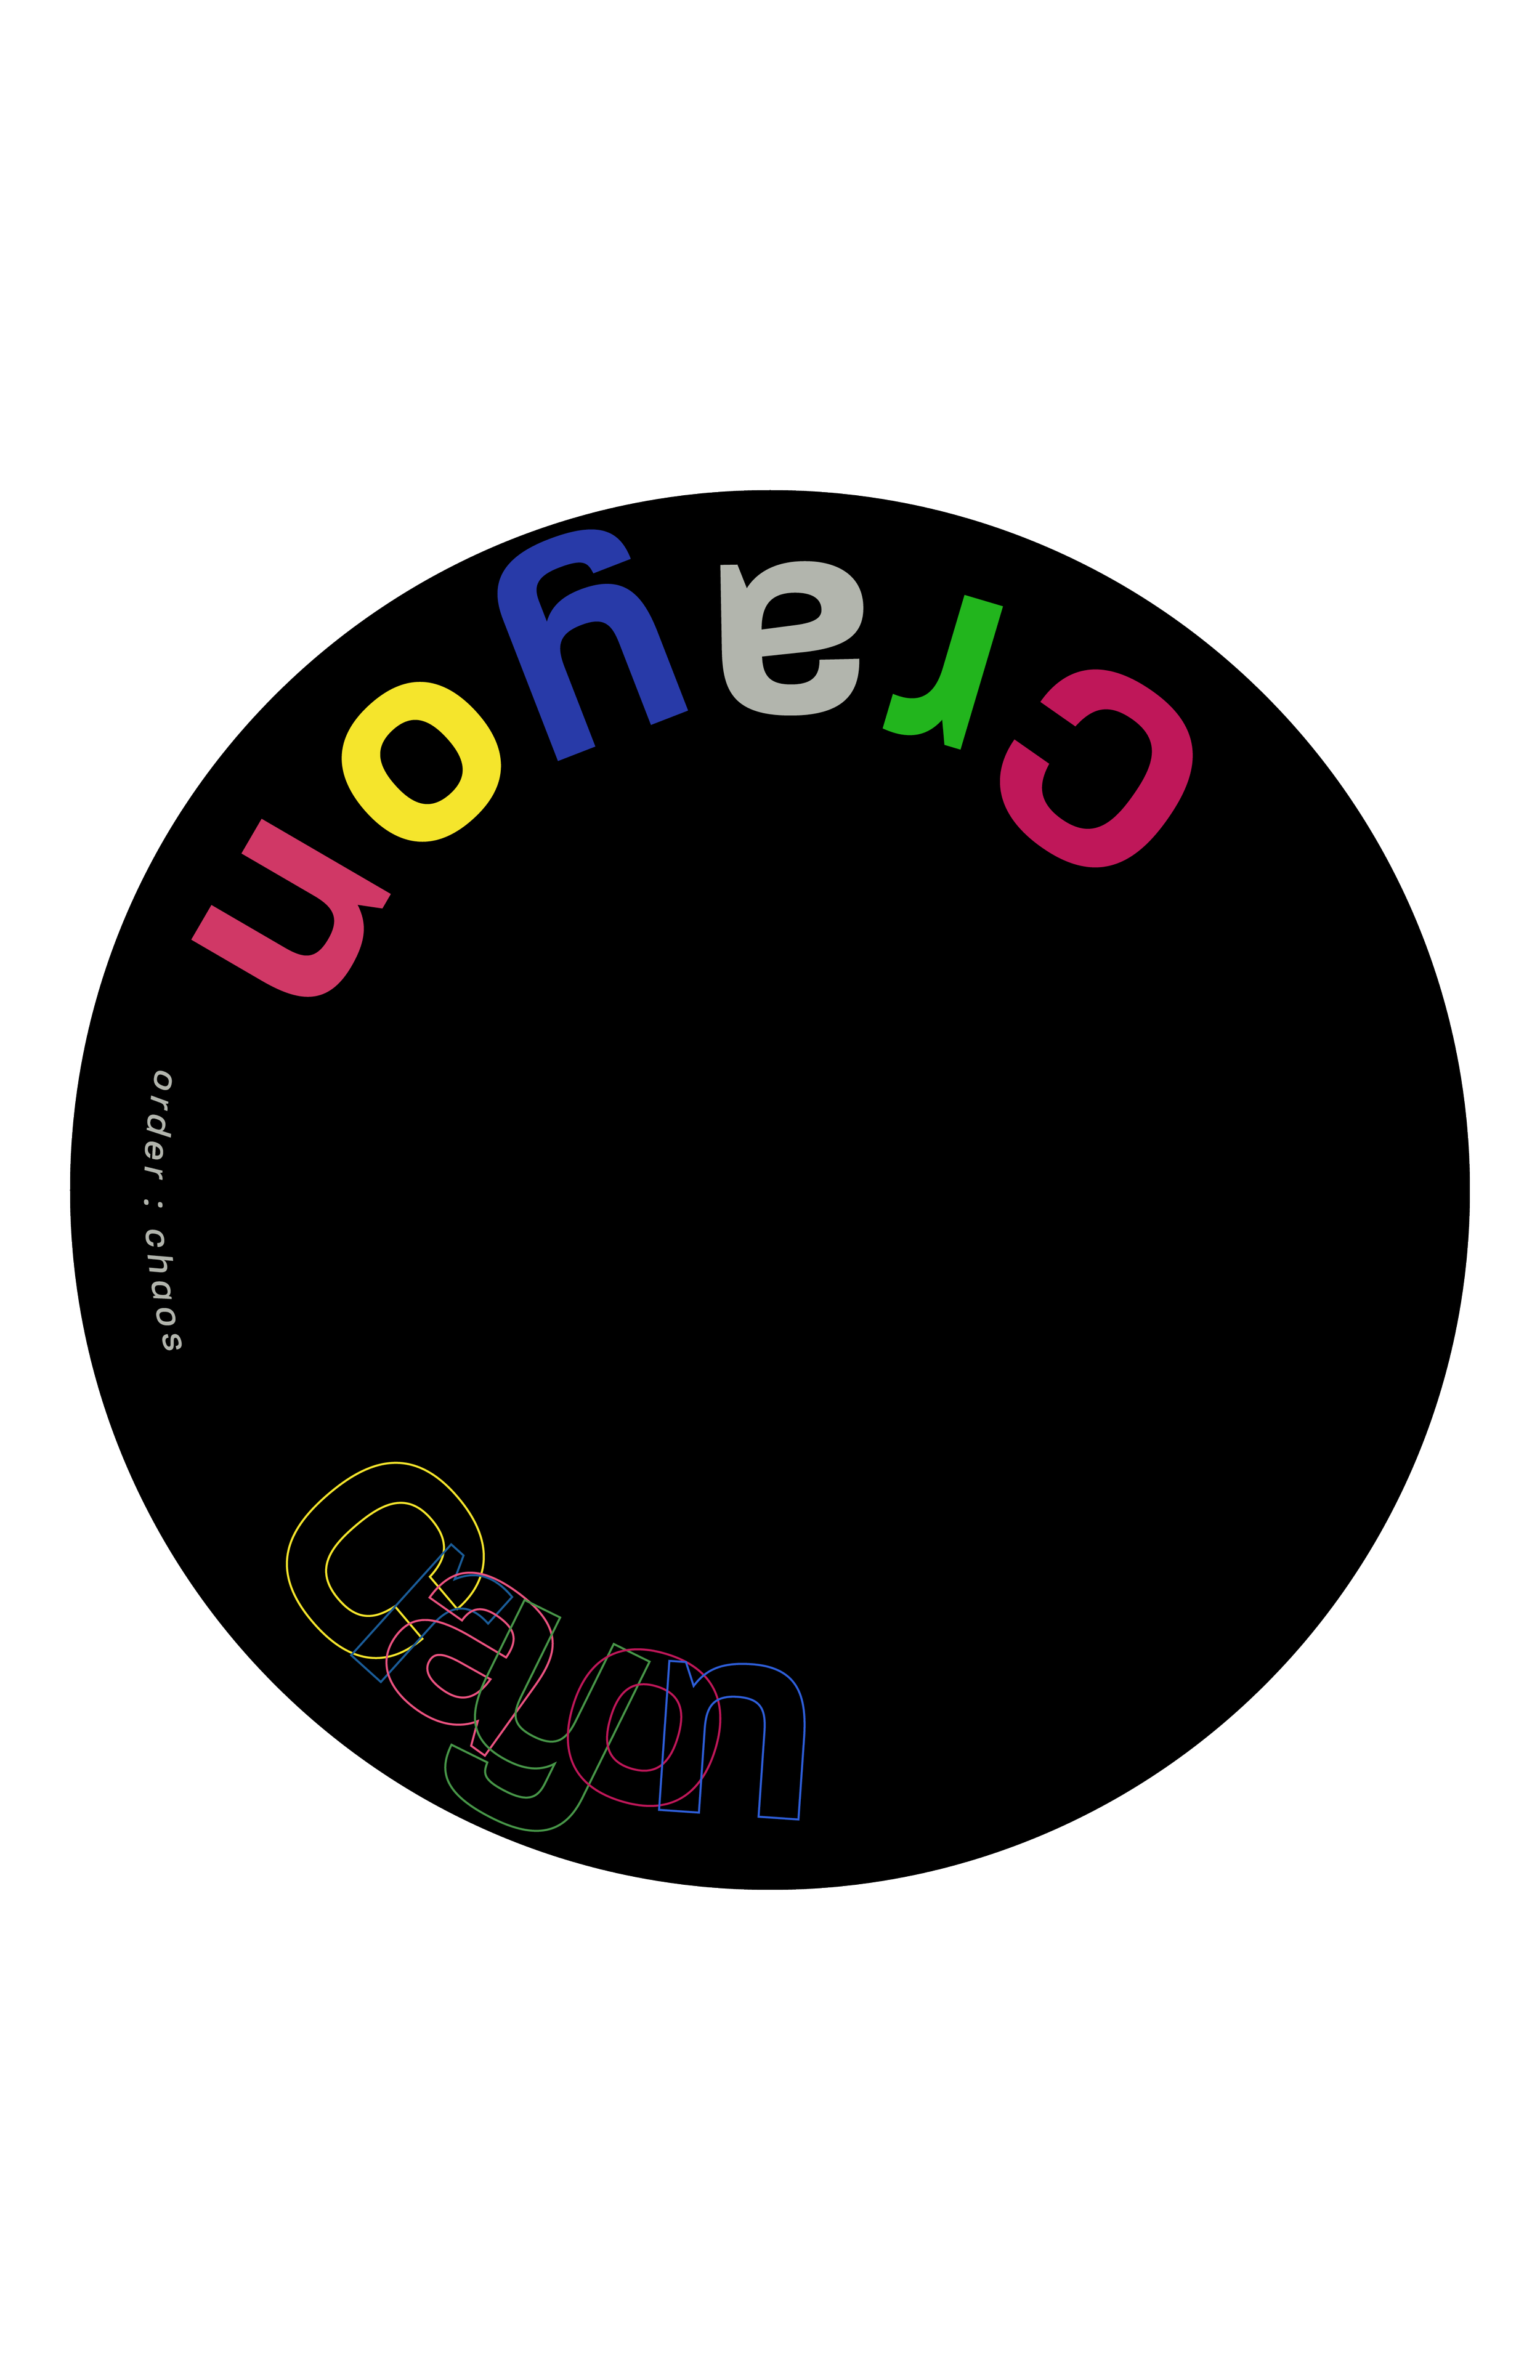
When closed, the book forms a precise circle, representing the crayons’ original state of order. As it unfolds, the pages expand into an increasingly dispersed composition, reflecting the fragmented state created by the blender. The physical structure therefore becomes part of the visualization, allowing readers to experience the progression of time through both information and form.
Role: Data Collection, Information Design & Book Production
Core Output: A hand-assembled circular book translating approximately 200 data points into a physical progression from order to chaos
Academic Data Visualization Project
Data Collection
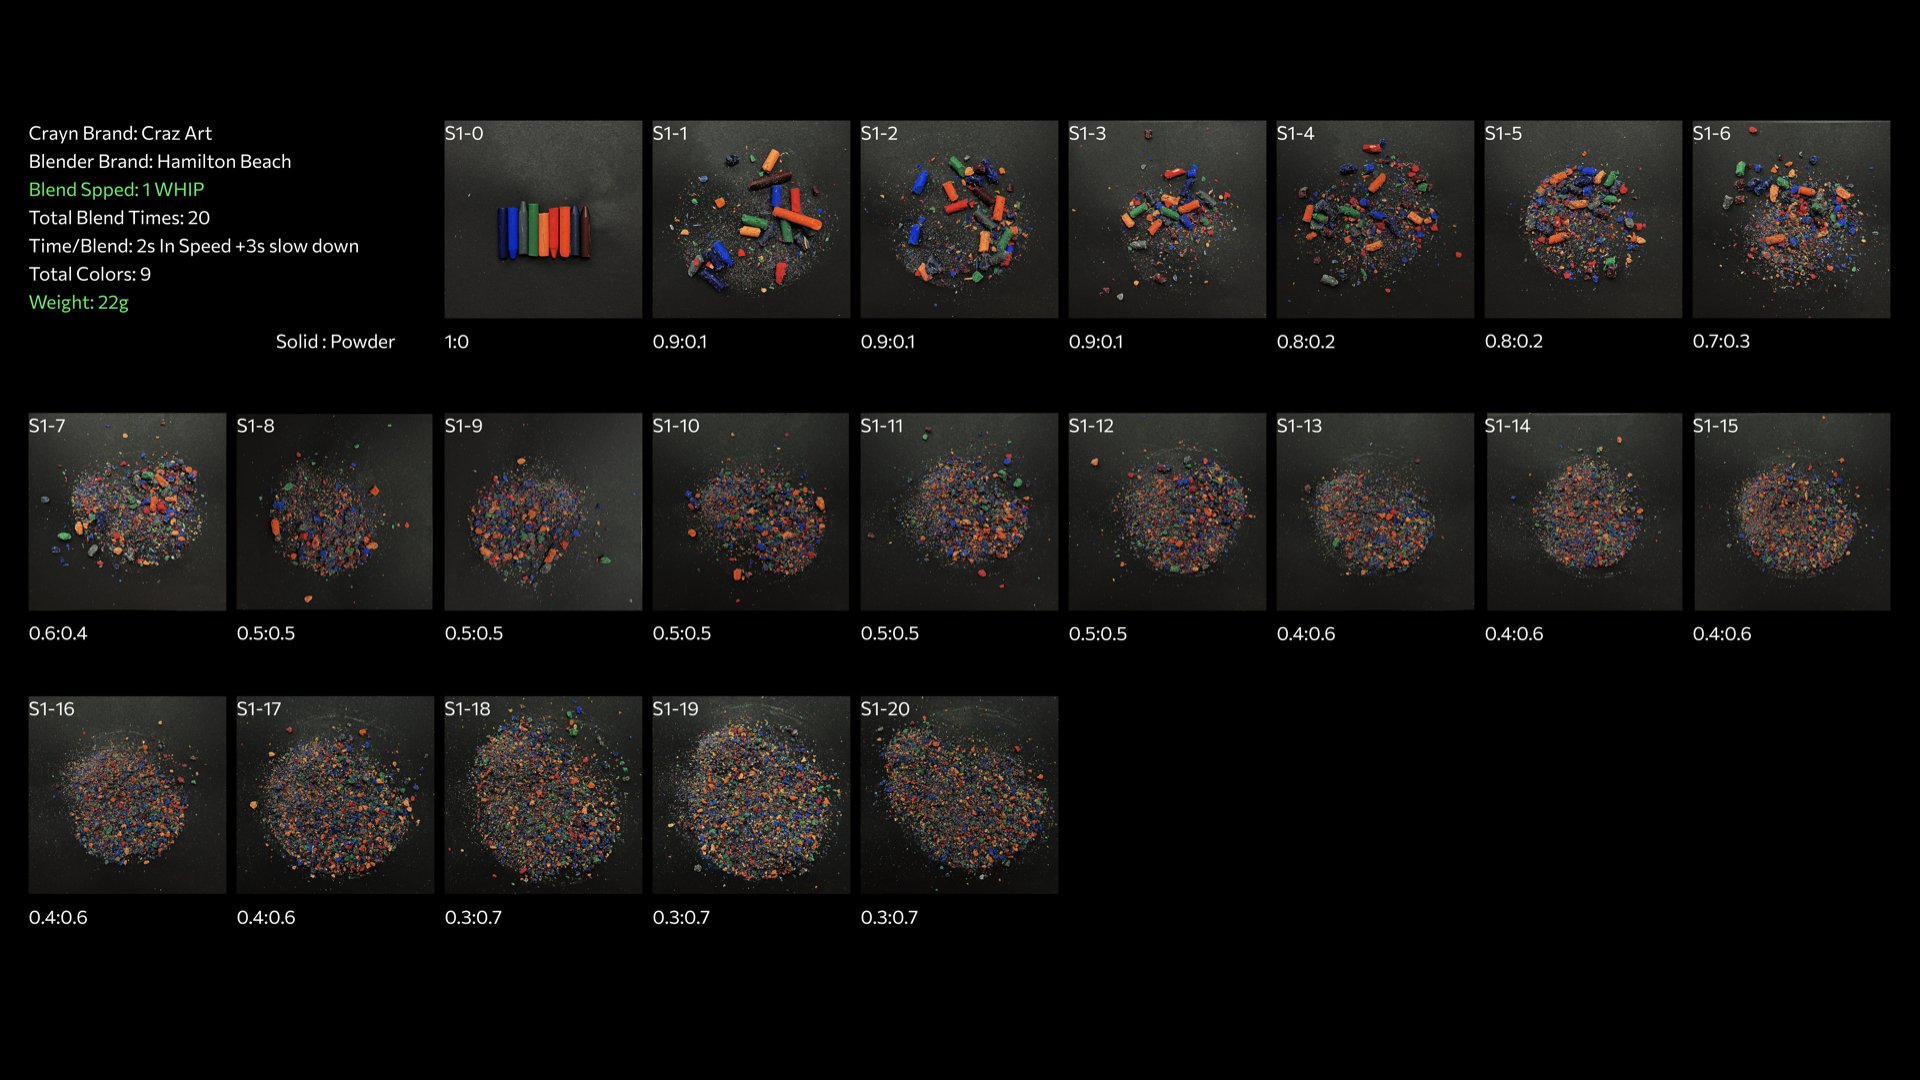
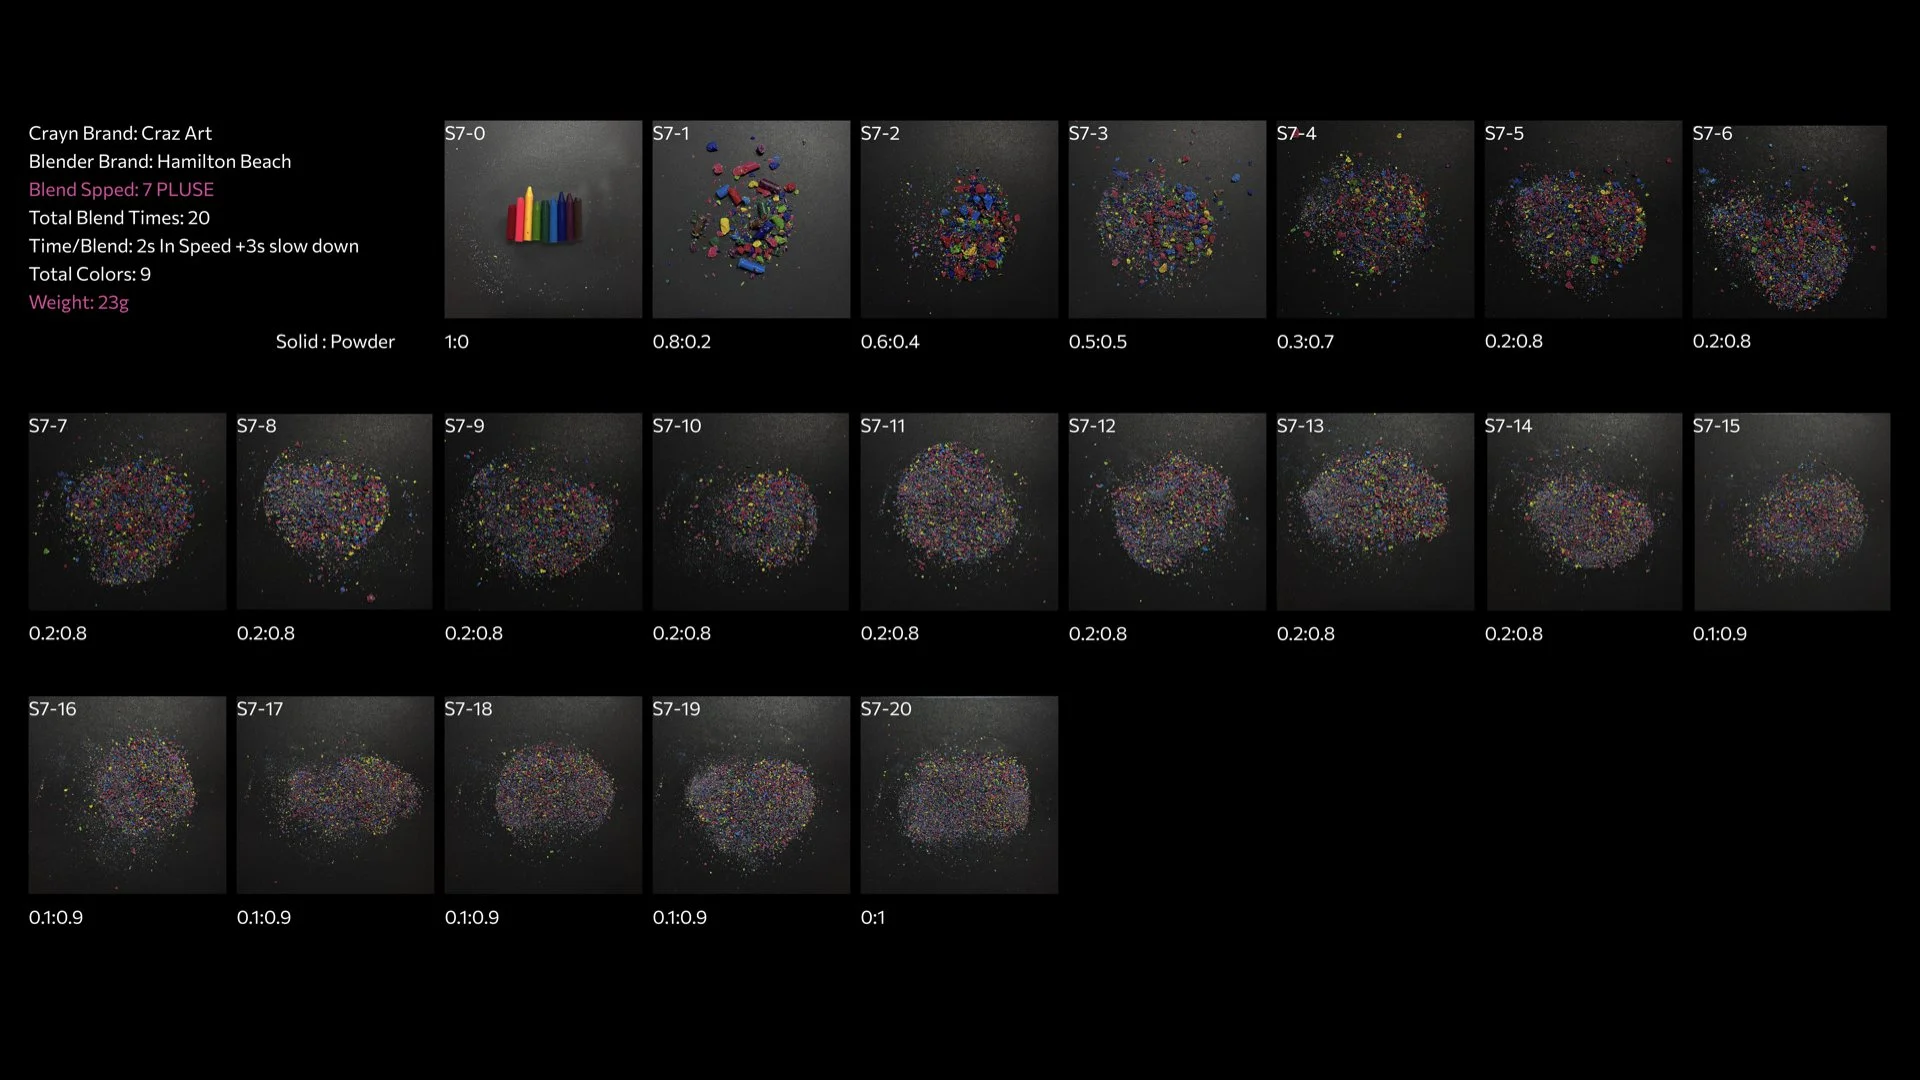
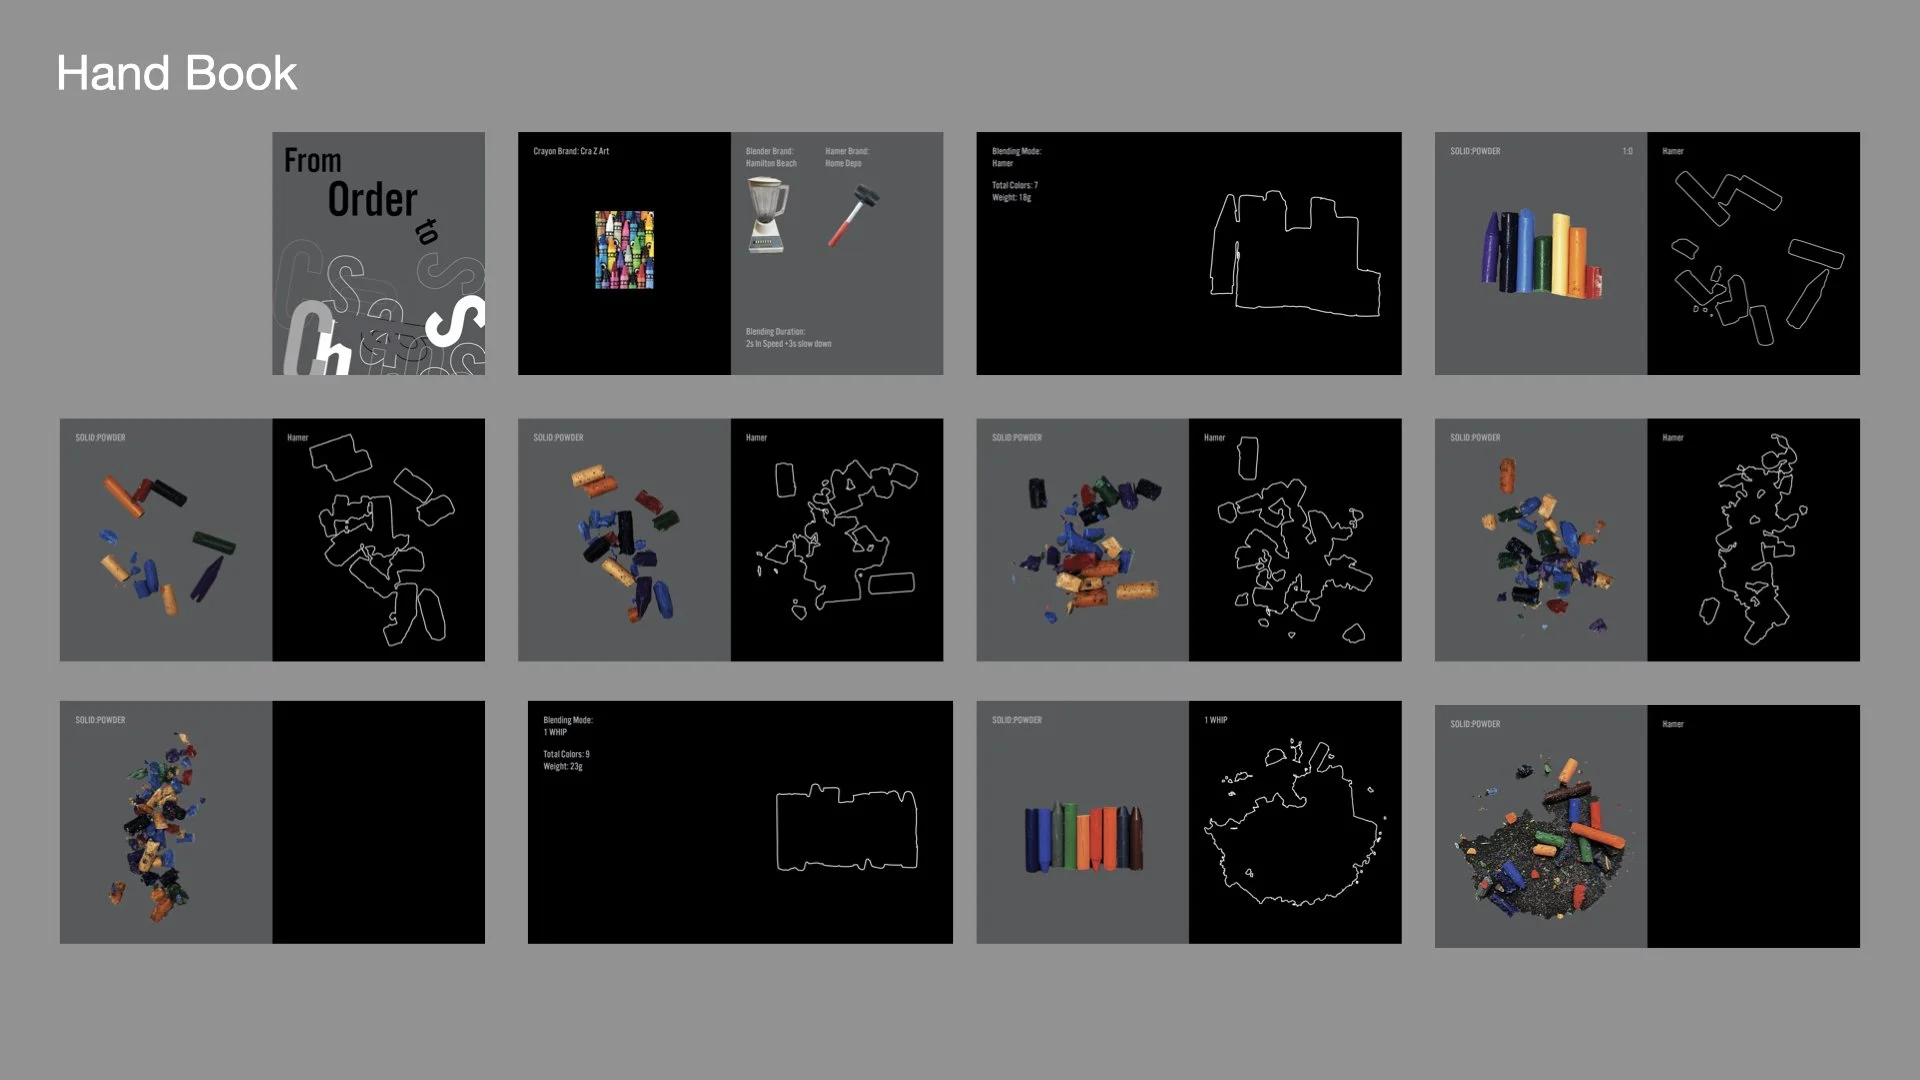
Iterations
Ver. 1
Ver. 2
Ver. 3
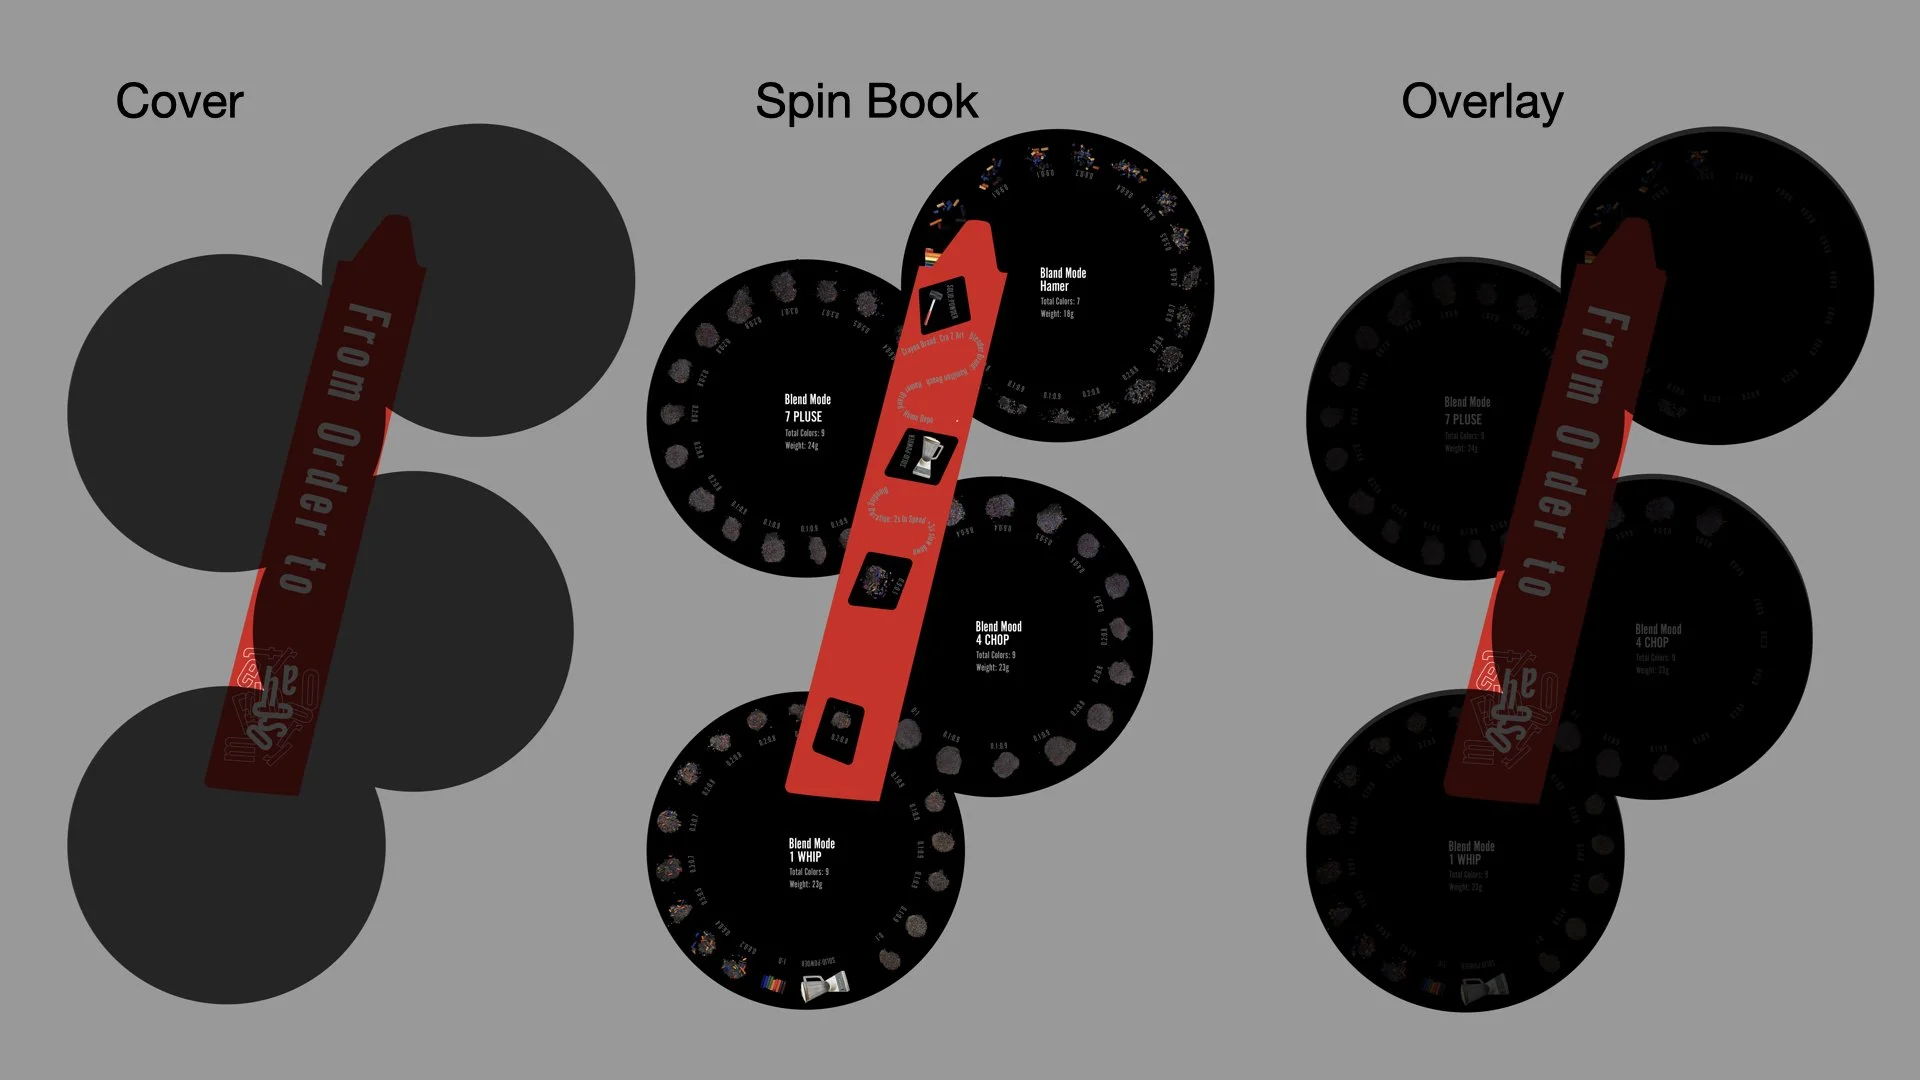





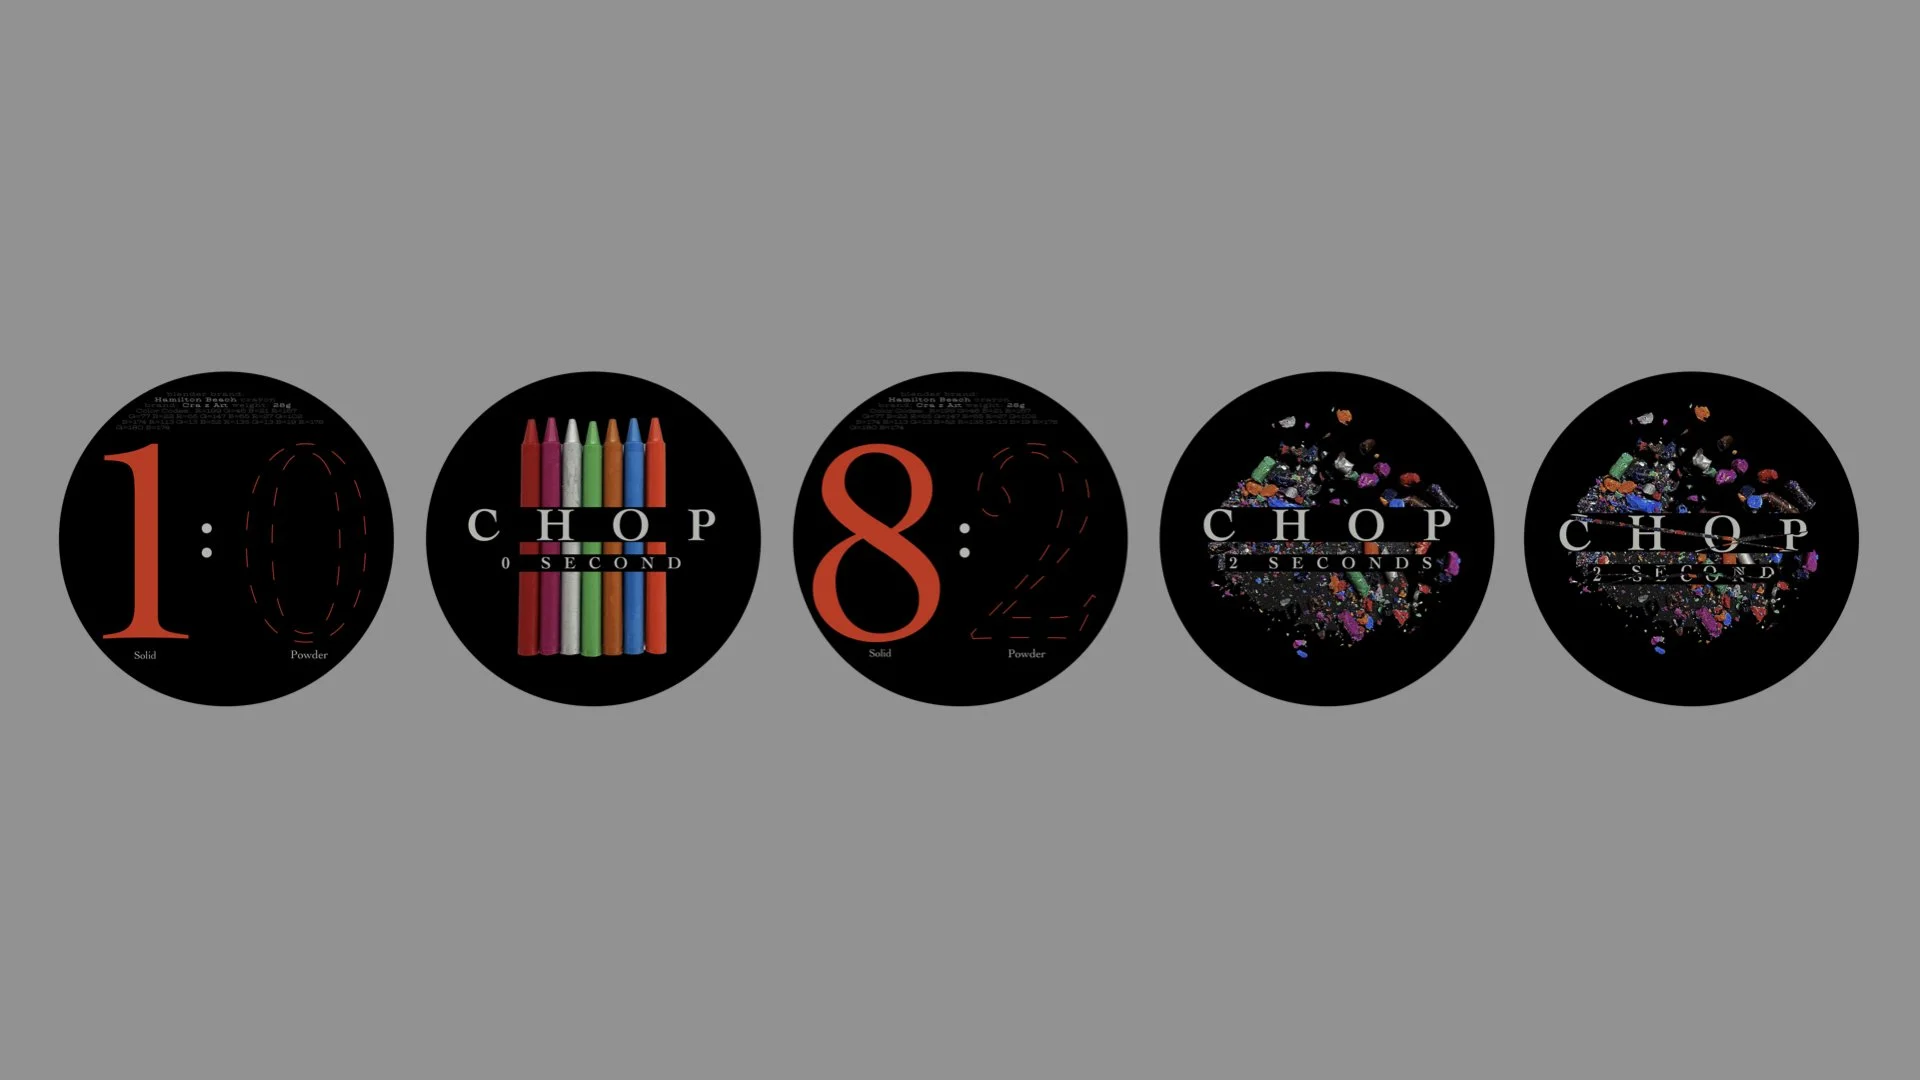
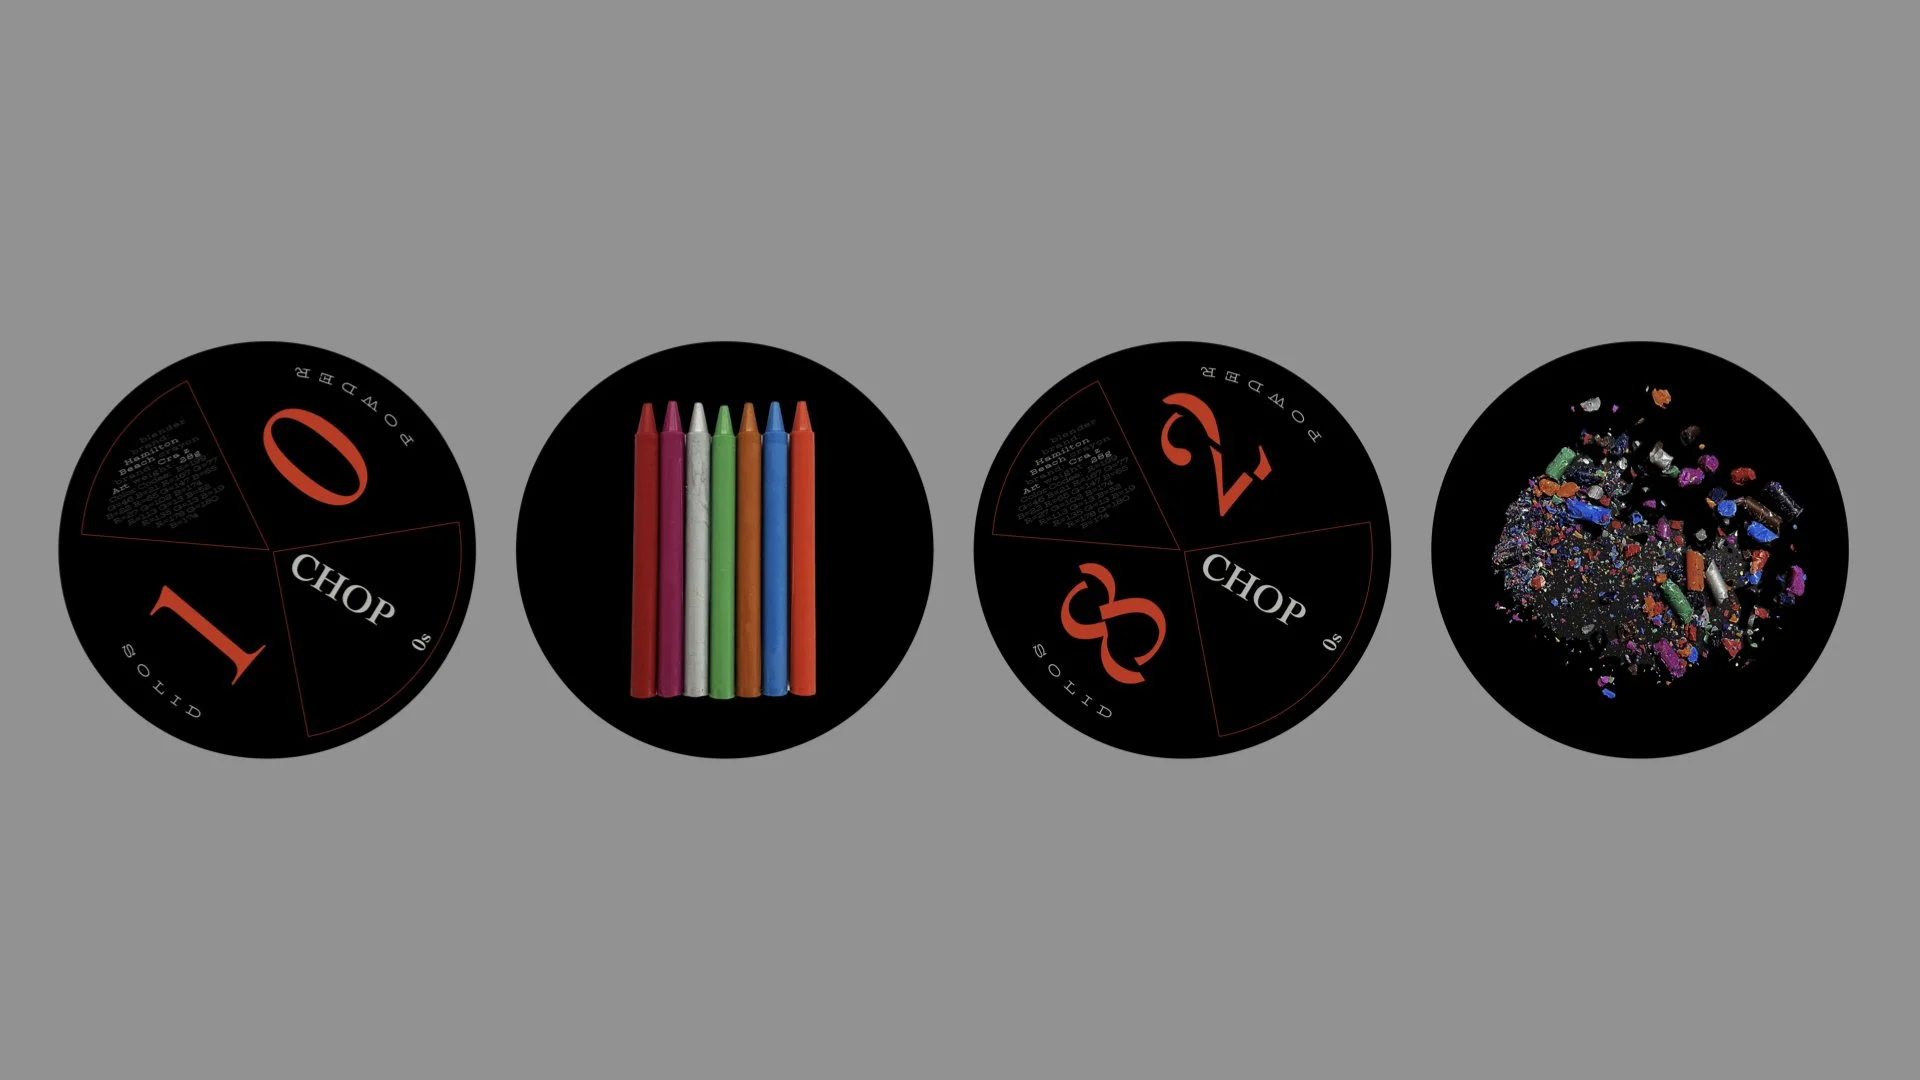
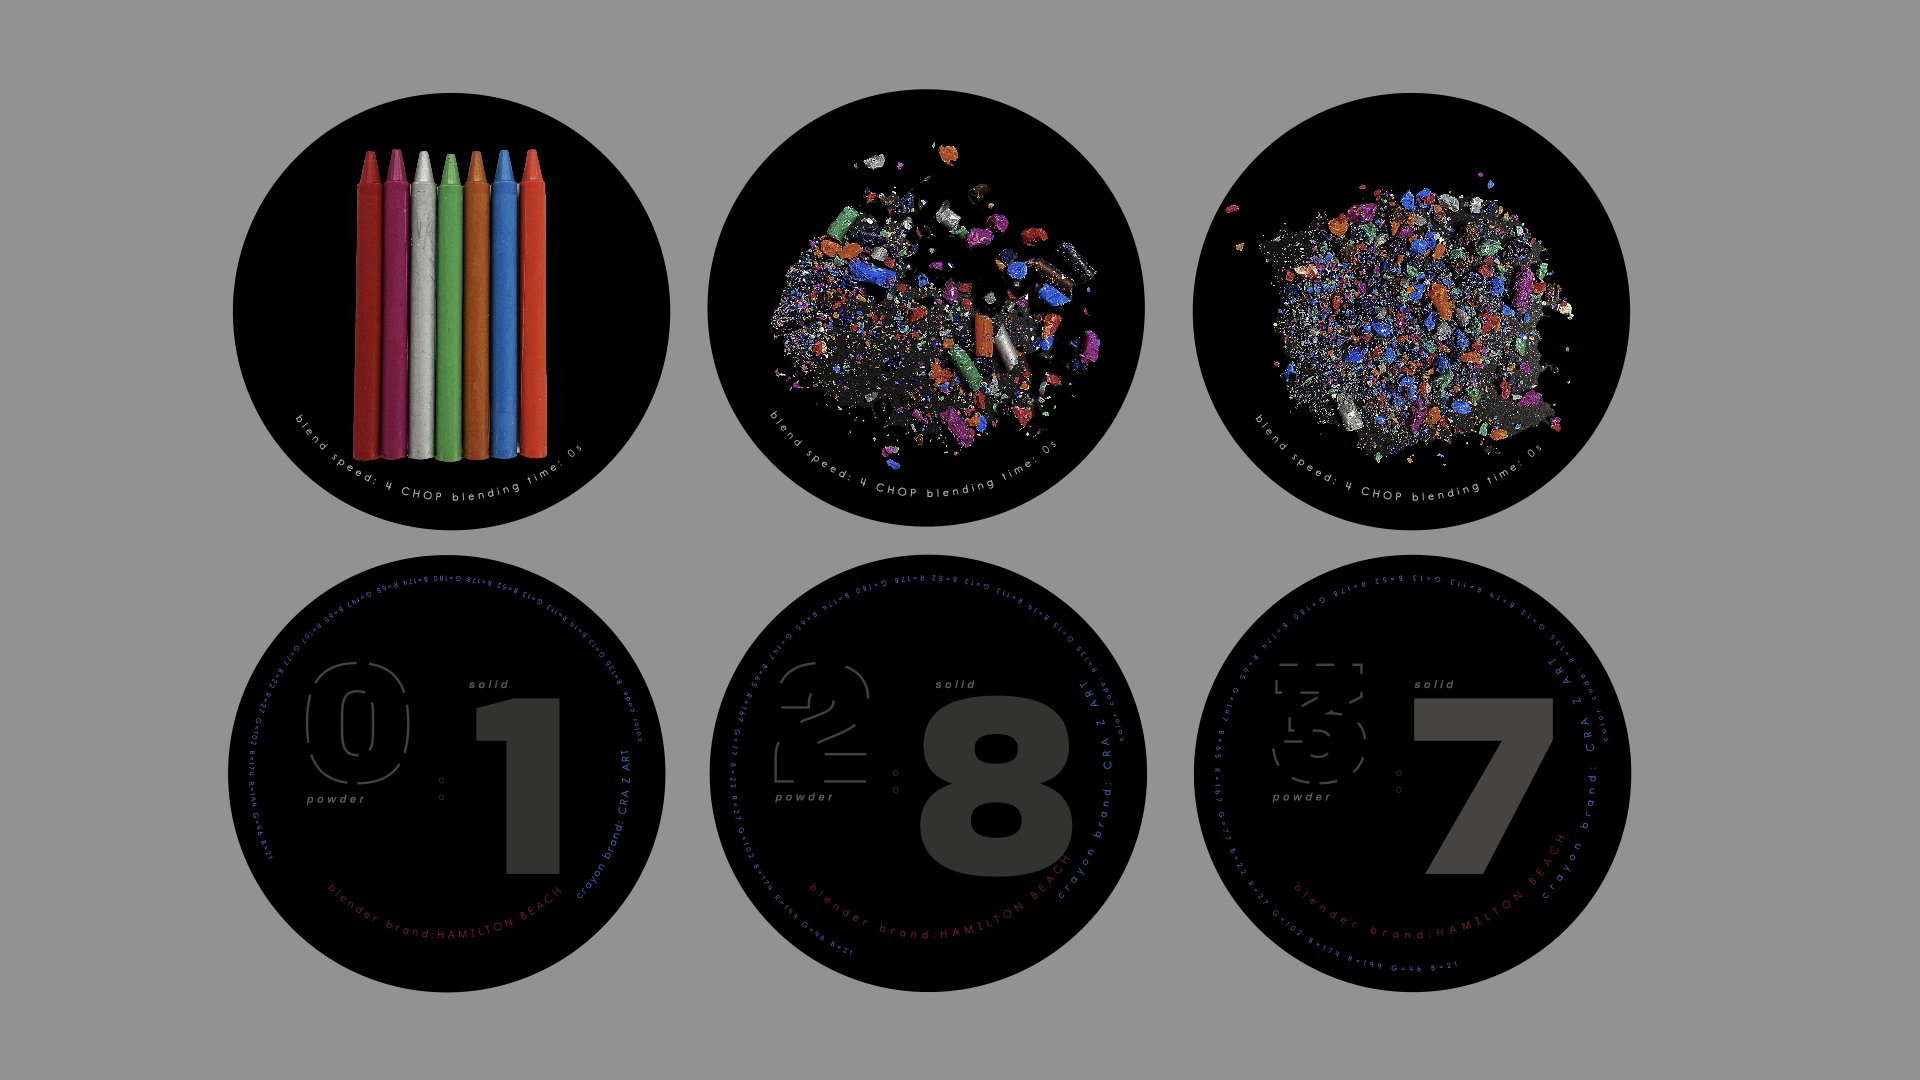
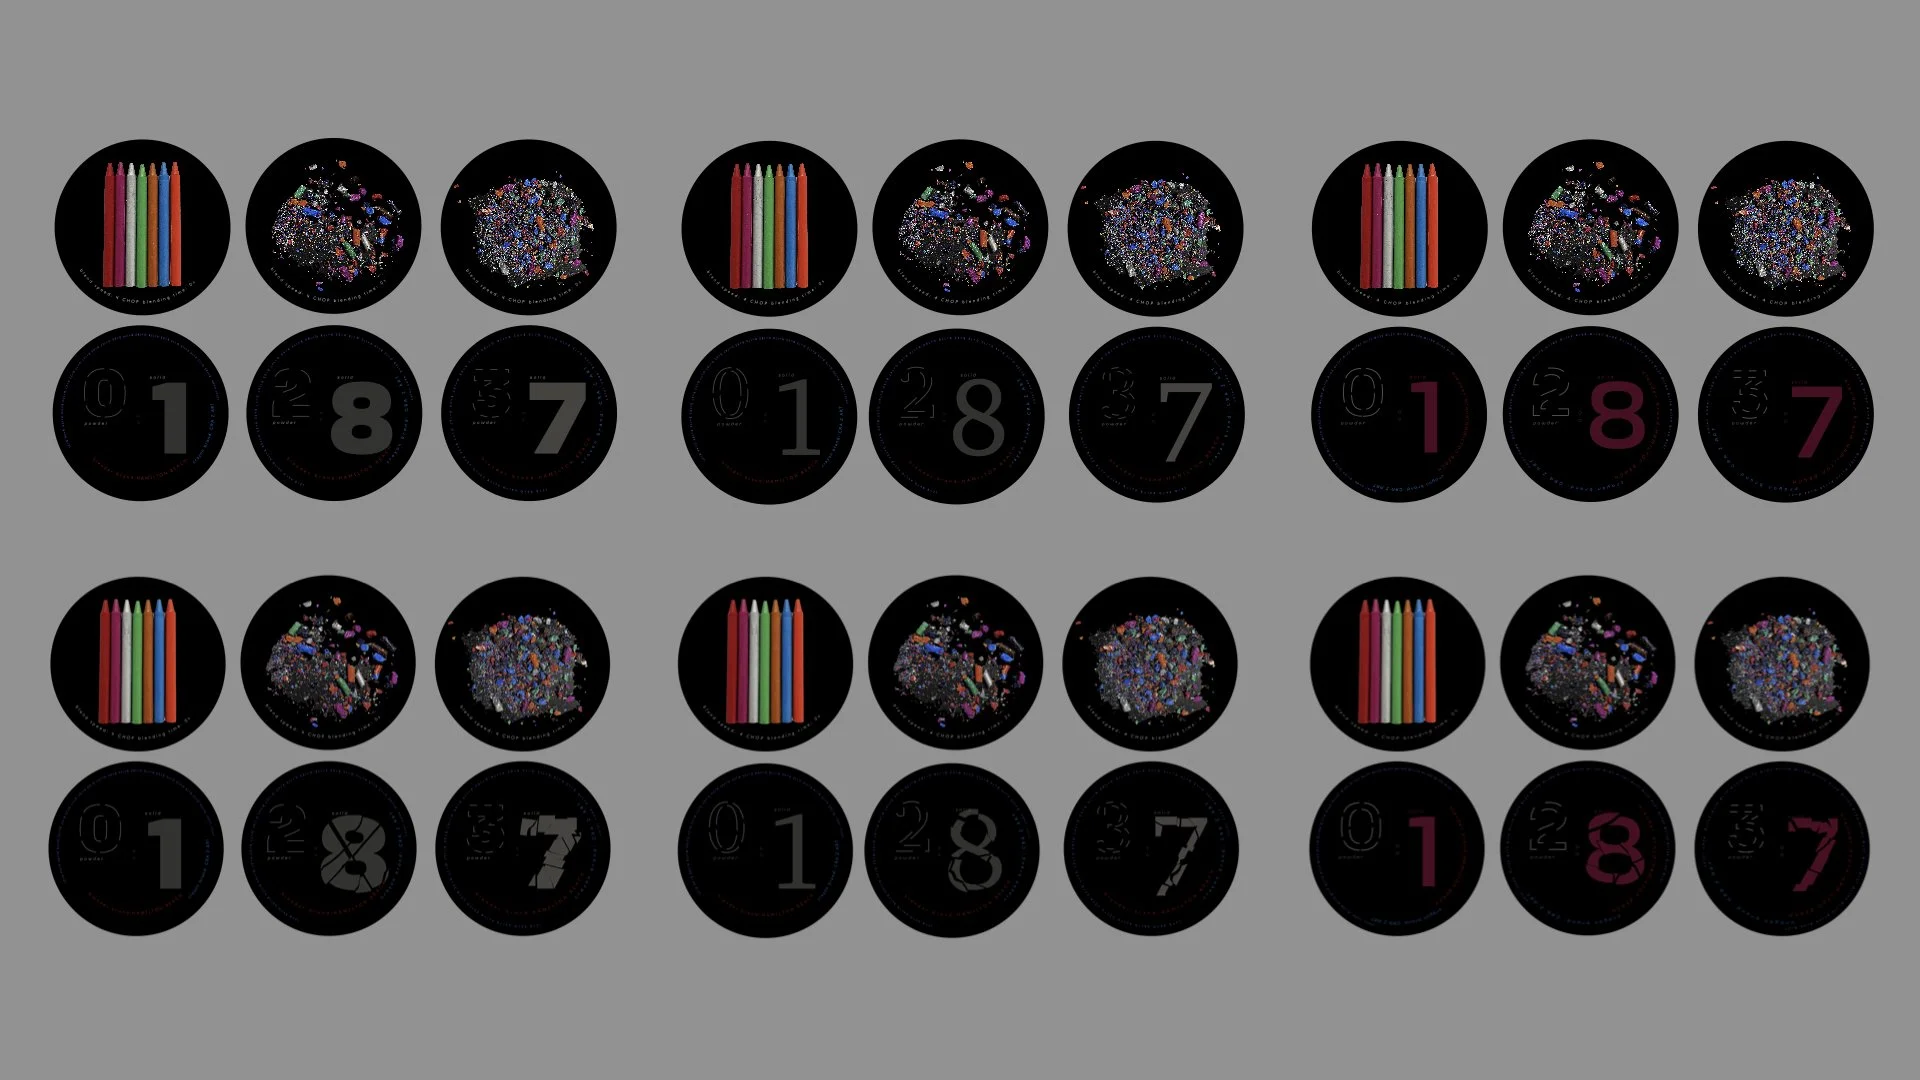
The Final